Cognitive load
Three separate literatures travel under this name: the capacity of working memory, Sweller's cognitive load theory of instruction, and the usability practice of measuring perceived workload. They disagree about almost everything except that novel information is processed in a small, temporary store.
The memory limit is real and the famous number attached to it is wrong. Miller (1956) measured a mean channel capacity of about 2.6 bits — roughly 6.5 categories — for the span of absolute judgment, kept that separate from the chunk limit on immediate memory, and wrote of the recurring seven: “But I suspect that it is only a pernicious, Pythagorean coincidence.” Cowan's reconsideration puts the real figure at about four chunks, “a central memory store limited to 3 to 5 meaningful items in young adults,” and only under conditions that stop people helping themselves: rehearsal blocked, grouping prevented, sensory memory wiped by a following jumble. None of that is a budget for how many things may appear on a screen; a visible list is not held in memory at all.
The menu-count rule derived from Miller has been tested and it does not hold. Larson and Czerwinski (1998) gave 19 experienced web users three hierarchies over the same 512 items: the deepest 8×8×8 tree was slowest at 58 seconds, 32×16 took 46, and the broadest 16×32 was fastest at 36. In the older menu work they review, memory span was not predictive of performance in any condition, while visual scanning was, especially in the deepest hierarchies. Breadth is paid for by looking, not by remembering, which is why cutting a list to seven items buys you a deeper tree and a slower screen.
Cognitive load theory is the instructional literature, and it is strongest where it is most concrete. Sweller, van Merriënboer and Paas (2019) report that nearly all the effects established by 1998 were reductions in extraneous load: worked examples, their strongest claim; split attention, where a diagram and the statements that explain it have to be mentally integrated unless you physically integrate them; and redundancy, where a diagram plus a full prose restatement of the same content was worse than the diagram alone. Pooling 29 systematic reviews covering 1,189 studies and 78,177 participants, Noetel and colleagues (2022) found the integration results survive best: contiguity at g = 0.74, spatial contiguity on its own at g = 0.63, and signalling — arrows, highlights, cues telling the eye where to go — at g = 0.43. Putting the label on the thing it labels, and pointing at what matters, are the best-evidenced moves in this literature. They are measured as learning outcomes, not as completion or revenue.
The prescription everyone repeats — remove unnecessary elements — measures weakest in exactly the case an app is. In the same overview, removing seductive and irrelevant detail came to g = 0.33, and it splits sharply on whether the clutter persists: g = 0.43 when the distracting material stayed on screen against g = 0.12 when it was transient. Two moderators matter more than the principle itself. Complexity: g = 0.70 for high element-interactivity material against g = 0.20 for simple material. Pacing: g = 0.41 when the material was system-paced like a lecture, against g = 0.27 when learner-paced “like on a website,” because a self-paced user manages their own load. The hypothesised expertise reversal did not survive meta-analytically — prior knowledge did not moderate the effects — and verbal redundancy came out asymmetric rather than harmful: adding text to audio helped at g = 0.29, while adding audio to text did nothing, g = −0.04.
Offloading memory onto the interface has a different problem, which is that users will do it whether or not it helps them. In three experiments by Gilbert and colleagues (2020), people could hold intentions in their own memory for full marks or set external reminders for a smaller payout per item, and they “were significantly biased towards using external reminders, even when they had a financial incentive to choose optimally.” The bias was stable when the same participants returned weeks later and was predicted by erroneous metacognitive underconfidence in their own memory; advice about which strategy would actually score better removed it, so it is not a general aversion to effort. Autofill, saved cards and recently-used lists will be taken up readily, and that is the argument for offering them. It is also the warning: once a value lives only in your interface, whether the user can still see and change it before committing is the whole of the design.
The theory's middle construct has been given up, and its instruments are unsettled. De Jong's (2010) review states that “cognitive load theory is constructed in such a way that it is hard or even impossible to falsify,” because with one kind of load that is good, one that is bad and one that is simply there, “every outcome fits within the theory post-hoc.” Sweller and colleagues then narrowed it themselves in 2019, describing germane load as redistributing working memory resources rather than adding to the total and concluding that “only intrinsic and extraneous cognitive load are distinguished as basic categories of cognitive load.” The field's workhorse measure is a single nine-point rating of perceived mental effort (Paas 1992), collected after the task: it is not concurrent, it does not measure overload, and by Sweller's own account it “cannot easily be used to differentiate between the different types.” The NASA-TLX (Hart 1986), the instrument most HCI teams reach for, is a weighted average of six subscales, two of which are not demand at all — Performance asks how successful you think you were, Frustration how irritated and stressed you felt. A TLX score that drops may mean less was asked of the user, or only that they felt better about how it went.
And the obvious way to reduce load — strip the interface back — has been measured going the wrong way. Burmistrov and colleagues (2015) ran 20 experienced users through matched flat and traditional versions of three tasks with eye tracking. Finding a target icon took 15.4 seconds in the flat set against 8.0 in the realistic one, and on screenshots of real sites both error types rose: misses from 26.0% to 35.8%, false alarms from 16.6% to 28.0%. Light and ultralight type cost no time but produced longer fixations and shorter, slower saccades, the signature of harder processing. This is one small single-lab study, n = 20, on 2014 stimuli, and not a verdict on flat design in general. It does establish the failure mode: removing the cues that mark a thing as pressable does not remove work, it moves the work from reading to guessing, and guessing shows up as errors rather than as time.
When it holds
- The information has to be held in mind rather than looked at. The 3-to-5-chunk limit is observed only when rehearsal is blocked, grouping is prevented and sensory memory is wiped; a list on screen is not a memory task (Cowan 2001, 2010).
- The material is complex. Across meta-analyses, design principles were worth g = 0.70 for high element-interactivity material and only g = 0.20 for simple material.
- Weaker when the user sets the pace. Effects were g = 0.41 in system-paced settings against g = 0.27 when learner-paced “like on a website,” which is the case an app is.
- Clutter costs most when it persists. Removing seductive detail was worth g = 0.43 when the distraction stayed on screen and g = 0.12, with a confidence interval through zero, when it was transient.
- Not by cutting the number of visible items. Over 512 items, a 16×32 hierarchy was searched in 36 seconds against 58 for 8×8×8, and memory span did not predict performance in any menu condition while visual scanning did.
- Redundancy is not uniformly harmful. Adding text to audio helped at g = 0.29; adding audio to text did nothing, g = −0.04.
- The expertise reversal everyone cites was not robust. Prior knowledge did not moderate design effects once the reviews were pooled, with individual reviews splitting in both directions.
- It reverses when simplification removes affordance. Flat icon search took 15.4 seconds against 8.0, and on flat pages misses rose from 26.0% to 35.8% and false alarms from 16.6% to 28.0% — n = 20, one lab, 2014 stimuli.
- Germane load is not a lever. Its own authors now describe it as redistributing working memory resources rather than adding to the total, leaving “only intrinsic and extraneous cognitive load … as basic categories.”
How to apply
- Put every label, unit, error and helper next to the field it belongs to, not in a legend, a tooltip or a block above the form. Contiguity is the best-evidenced move in this literature at g = 0.74, and it costs nothing to implement.
- Prefill anything the user already told you earlier in the same process. WCAG 2.2 Success Criterion 3.3.7 Redundant Entry (Level A) requires that previously entered information be auto-populated or available to select, excepting where re-entry is essential, is needed for security, or the earlier value is no longer valid.
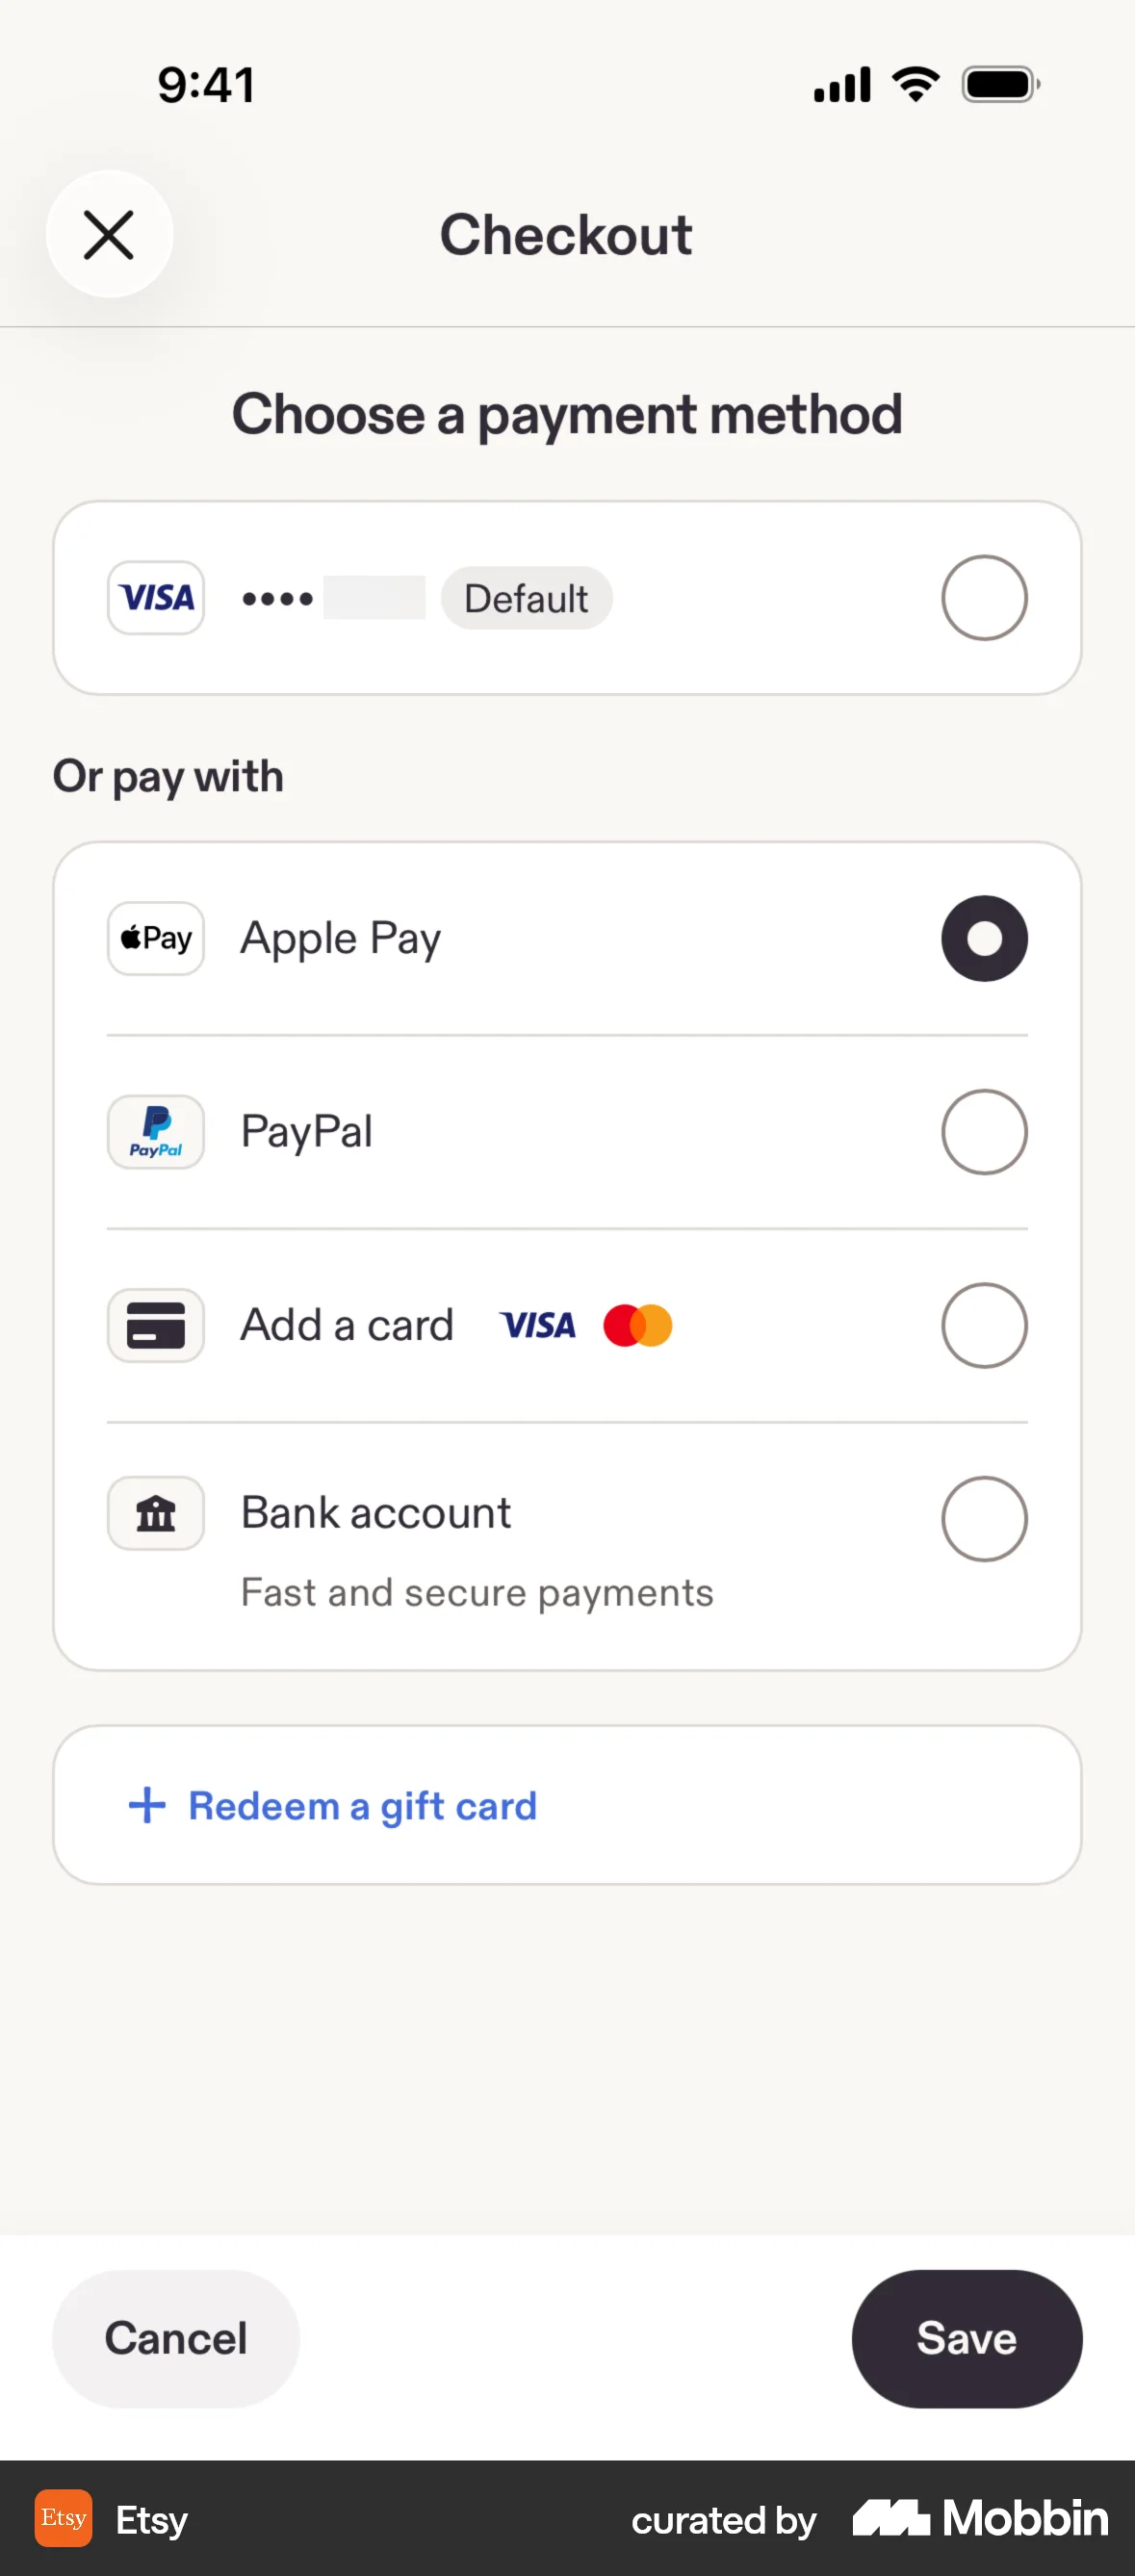
- Offer recognition instead of recall at the moment it matters: a saved-card list rather than a typed number, an address picker rather than a blank field, the plan they are on shown on the screen that asks them to change it.
- Show every prefilled value in full and leave it editable in place. People take up external memory readily even when it scores worse for them, so a field they never read is a commitment they never made.
- Offer a way in that is not a remembered password. WCAG 2.2 Success Criterion 3.3.8 Accessible Authentication (Minimum, Level AA) forbids requiring a cognitive function test at any authentication step unless that step also offers an alternative method, a mechanism to help complete it, object recognition, or user-provided personal content — which is what makes passkeys and paste-enabled password fields a conformance matter, not a nicety.
- Signal rather than subtract: an arrow, a highlighted row, a short lead-in that says what this step decides. Signalling raised learning at g = 0.43 and lowered measured load at g = 0.25.
- Delete decoration, keep controls. The measured version of this is removing material irrelevant to the task — background video, a mascot, a tangential illustration — and the effect doubles when that material would otherwise sit on screen the whole time.
- Keep every control marked as a control — a border, a fill, a hairline, a cursor change. On flat pages users missed a third of the clickable areas and clicked unclickable ones 28% of the time, so an interface can be visually quieter and functionally slower at once.
What to avoid
- Quoting 7±2 to justify a count. Miller measured 2.6 bits for absolute judgment, kept chunks and bits as separate limits, and called the recurring seven “a pernicious, Pythagorean coincidence”; the current estimate is 3 to 5 chunks, and neither figure is about items visible on a screen.
- Simplifying by hiding. The EDPB's deceptive design guidelines name Too many options under the Overloading category (Annex I 4.1.3) where a control is “spread across several pages” or the difference between the options is left unclear, and find it capable of infringing Article 12(1) GDPR together with the fairness principle in Article 5(1)(a).
- Buying brevity with vagueness. The same guidelines treat Ambiguous wording or information under Left in the dark as its own pattern, holding that where “average users would not understand the genuine message of the information without special knowledge, the conditions of Article 12(1) GDPR are not met.” “Your data might be used to improve our services” is their worked example.
- Reducing the load on the choice the user would otherwise reconsider. A cancellation, consent or downgrade flow made frictionless in the accepting direction and effortful in the protective one is not a load reduction; it is the asymmetry regulators read as obstruction.
- Treating a lower NASA-TLX score as proof. Two of its six subscales are self-rated performance and frustration, so the composite can fall because people felt better rather than because less was asked of them. Report the task metrics alongside it.
- Claiming you reduced extraneous load and raised germane load. De Jong's review calls the three-load scheme “hard or even impossible to falsify” for exactly this reason, and the theory's authors have since dropped germane load as a separate category of load.
- Stripping affordance in the name of minimalism. Lighter type produced longer fixations and slower saccades at no time saving, and flat controls cost 0.2 seconds per screen area and roughly ten extra percentage points of error in both directions.
Real-world examples




Measuring it
- Primary metric: task completion and time-to-complete for the specific step you changed, split by first-time and returning users. A screen is easier when the work gets done faster, not when it rates calmer — treat any self-reported effort score as one input, because the field's standard item is collected after the task and does not measure overload.
- Secondary: error rate per field and per control — validation failures, corrections, undos, taps on non-interactive elements, and repeat visits to the same screen. This is where removed affordance shows up, because flat designs lost accuracy before they lost time.
- Backfire metric: comprehension of what the step did. Ask users to state what they just agreed to, what they will be charged and when; a load reduction that lowers correct answers is the Left in the dark pattern, not a win.
- Backfire metric: discoverability of the controls you tidied away. Track searches and support contacts for settings that still exist, and the share of users who ever reach the privacy, billing and cancellation screens before and after.
- Backfire metric: the protective-to-profitable ratio — reject-all against accept-all, cancel-completion against retention. If a simplification moved that ratio more than it moved completion time, you changed the choice rather than the effort.
References
- Miller (1956). The magical number seven, plus or minus two: Some limits on our capacity for processing information. Psychological Review.
- Cowan (2001). The magical number 4 in short-term memory: A reconsideration of mental storage capacity. Behavioral and Brain Sciences.
- Cowan (2010). The magical mystery four: How is working memory capacity limited, and why? Current Directions in Psychological Science.
- Larson & Czerwinski (1998). Web page design: Implications of memory, structure and scent for information retrieval. Proceedings of CHI 1998.
- Sweller, van Merriënboer & Paas (2019). Cognitive architecture and instructional design: 20 years later. Educational Psychology Review.
- de Jong (2010). Cognitive load theory, educational research, and instructional design: Some food for thought. Instructional Science.
- Noetel, Griffith, Delaney, Harris, Sanders, Parker, del Pozo Cruz & Lonsdale (2022). Multimedia design for learning: An overview of reviews with meta-meta-analysis. Review of Educational Research.
- Burmistrov, Zlokazova, Izmalkova & Leonova (2015). Flat design vs traditional design: Comparative experimental study. Proceedings of INTERACT 2015, LNCS 9297.
- Gilbert, Bird, Carpenter, Fleming, Sachdeva & Tsai (2020). Optimal use of reminders: Metacognition, effort, and cognitive offloading. Journal of Experimental Psychology: General.
- Hart (1986). NASA Task Load Index (TLX): Computerized version, volume 1.0. NASA Ames Research Center, Human Performance Research Group.
- W3C (2023). Web Content Accessibility Guidelines (WCAG) 2.2, Success Criteria 3.3.7 Redundant Entry and 3.3.8 Accessible Authentication (Minimum).
- EDPB (2023). Guidelines 03/2022 on deceptive design patterns in social media platform interfaces, version 2.0, Overloading and Left in the dark categories, Annex I items 4.1.3 and 4.6.
For agents
An agent-friendly guide to this principle lives at /agents/cognitive-load.md.
Our MCP server and skills for all principles are coming soon.
Similar principles
Disclaimer: The theories here are just that — theories. They may not apply universally and should be considered in context. Use your own judgment and consult additional sources when applying these principles.