Overjustification effect
The effect is about what happens after the reward is withdrawn, not during it. Rewards reliably increase the behaviour they are attached to while they are in force; the overjustification claim is that an already interesting activity gets picked up less often later, when nothing is on offer.
Two mechanisms are offered for it. The attributional one is self-perception: asked why they drew, or solved, or posted, the person now has a sufficient external reason available, and infers that the reward was the cause. The reward overjustifies an action that needed no justification, and the original interest is no longer the explanation they reach for.
The second mechanism, cognitive evaluation theory, is the one that survives contact with the moderators, because it predicts both directions. Every reward carries two aspects at once. A controlling aspect shifts the perceived locus of causality outward — I am doing this because the contingency requires it — and that costs autonomy. An informational aspect conveys competence — I did this well. Which aspect is salient decides the sign of the effect. That is why praise, which is almost all information, enhances intrinsic motivation, while a promised token for engaging in a task, which is almost all control, reduces it; and why the same praise, delivered in controlling language, flips to undermining. It also explains the measurement asymmetry that runs through the whole literature: the undermining effect appears in free-choice behaviour — whether people pick the activity up again when nobody is watching or paying — and barely appears in what people say about how much they enjoyed it. If you only ask, you will not see it.
The anchor is Deci, Koestner and Ryan's meta-analysis of 128 studies. Across 101 studies with a free-choice behavioural measure, all rewards together gave d = -0.24 (CI = -0.29, -0.19); across 84 studies with a self-report measure, d = 0.04 (CI = -0.02, 0.09), not significant. The structure sits in the moderators. All 92 tangible-reward studies gave d = -0.34 (CI = -0.39, -0.28) on free choice. Expected tangible rewards gave d = -0.36 (CI = -0.42, -0.30); the 9 studies of unexpected tangible rewards gave d = 0.01 (CI = -0.20, 0.22), and the 7 studies of task-noncontingent rewards gave a non-significant d = -0.14 (CI = -0.39, 0.11). By contingency: engagement-contingent d = -0.40 (CI = -0.48, -0.32, k = 55), completion-contingent d = -0.36 (CI = -0.50, -0.22), performance-contingent d = -0.28 (CI = -0.38, -0.18, k = 32). Verbal rewards ran the other way: positive feedback gave d = 0.33 (CI = 0.18, 0.43) on free choice across 21 studies and d = 0.31 (CI = 0.19, 0.44) on self-reported interest after three outliers were removed.
This was a contested literature, and the dispute is the most useful part of the record. Cameron and Pierce's 1994 meta-analysis reached the opposite conclusion and called for abandoning cognitive evaluation theory. As Deci, Koestner and Ryan report their figures, Cameron and Pierce found no overall reward effect on free-choice behaviour, enhancement on self-reported attitudes (d = 0.14), verbal-reward enhancement on both measures (d = 0.38 and 0.39), tangible-reward undermining on free choice (d = -0.21) and expected-tangible undermining on free choice (d = -0.25) — in other words, the same signs on the measures where the later analysis found them, read as a null because the aggregate was reported first. Deci and colleagues level four charges: collapsing across cells with significant interactions on theoretically meaningful variables, including initial task interest and informational versus controlling administration, without running those as moderators; using inappropriate control groups, including one study where every group received money and there was no no-reward control; misclassifying studies, including one whose method section states that rewards were given for working with a puzzle for at least eight minutes but which was coded as task-noncontingent; and omitting nearly 20% of studies as outliers rather than isolating the cause of the variance.
Cameron, Banko and Pierce then re-analysed the literature explicitly to resolve the difference. Their abstract still says that in general rewards are not harmful to motivation to perform a task — and then states the conditions: rewards given for low-interest tasks enhance free-choice intrinsic motivation; on high-interest tasks, verbal rewards produce positive effects on free-choice motivation and self-reported task interest; negative effects are found on high-interest tasks when the rewards are tangible, expected (offered beforehand), and loosely tied to level of performance. The two camps disagree about how to summarise that sentence. They do not disagree about the sentence. Design the interface from the conditions and the dispute is irrelevant to you.
The replication record is unusually clean for a 1970s effect. Lehtivuori's 2023 doctoral meta-analysis ran a fresh systematic search of seven databases, 158 qualifying articles, and synthesised 142 randomised controlled laboratory experiments from 125 published articles. The free-choice numbers land on top of the 1999 ones: all rewards d = -0.28, tangible d = -0.39, expected d = -0.41, engagement-contingent d = -0.42, completion-contingent d = -0.48, performance-contingent d = -0.24, unexpected d = -0.04 and not significant, rewards not tied to doing a specific task d = 0.10 and not significant, positive feedback d = 0.33. The self-report analysis again showed weaker effects, with engagement-contingent rewards the only undermining contingency (d = -0.16). A third meta-analysis in the same thesis, of 42 independent samples from 35 articles in work settings, found no significant overall association between extrinsic rewards and intrinsic work motivation; base salary and positive feedback were positively associated (r = 0.19 each), performance-based rewards were null and extremely heterogeneous (r = 0.05), and performance-based rewards perceived as more controlling than informational were weakly negative (r = -0.10).
Two studies take it out of the one-session lab. Greene, Sternberg and Lepper ran a token economy in two classrooms: 44 children, 11 per condition, 13 days of baseline, 13 of treatment and 13 of withdrawal, with time spent on target maths activities recorded unobtrusively. The reinforcement worked — every experimental group increased time on target during treatment, all within-group differences significant at p < .01. After the tokens were withdrawn, all three experimental groups spent less time on their target activities than they had at baseline, significantly so for the choice group, t(10) = 4.14, p < .01, and the high-interest group, t(10) = 2.38, p < .05. The low-interest group's decrement was not significant. Murayama, Matsumoto, Izuma and Matsumoto induced the effect in adults with a performance-based monetary reward and tracked it with fMRI: reward undermined intrinsic motivation as measured by the number of voluntary engagements in the task, and activity in the anterior striatum and prefrontal areas decreased along with the behavioural effect.
The counterweight matters as much as the effect. Cerasoli, Nicklin and Ford's 40-year meta-analysis (k = 183, N = 212,468) found intrinsic motivation to be a medium to strong predictor of performance (ρ = .21–.45) and that the importance of intrinsic motivation to performance remained in place whether or not incentives were presented. Incentive salience changed its predictive weight in a crowding-out pattern — intrinsic motivation mattered less where incentives were directly tied to performance — but their conclusion is that incentives and intrinsic motivation are not necessarily antagonistic and are best considered simultaneously. They also found the division of labour that should govern your metric choice: intrinsic motivation predicted more unique variance in quality of performance, incentives in quantity.
The one piece of directly relevant interface evidence is a null on motivation and a hit on volume. Mekler, Brühlmann, Tuch and Opwis ran a 2 × 4 online experiment (N = 273) on an image annotation task, comparing points, levels and a leaderboard against a control. Game elements significantly increased the number of tags generated, F(3, 265) = 10.09, p < .001, partial eta squared = .103, with points beating control (t(141) = 2.613, p = .01, d = .44) and leaderboard and levels in turn beating points (d = .39 and d = .35). Tag quality did not differ, F(3, 265) = .727, p = .537. Intrinsic motivation did not differ either (p = .702), nor did competence need satisfaction. Their reading is that the elements functioned as extrinsic incentives, effective only for promoting performance quantity. So the evidence for undermining in digital interfaces specifically is one experiment that found no effect on intrinsic motivation in either direction — the strong evidence here is for the lab effect and its conditions, not for a measured collapse of motivation inside a product.
When it holds
- The activity has to be intrinsically interesting to begin with. This is the condition people skip, and it is the largest moderator in the file. In the 11 studies that manipulated task interest within the same experiment and used a free-choice measure, reward effects on interesting versus uninteresting activities differed at Qb(1) = 31.67, p < .0001: interesting tasks gave d = -0.68 (CI = -0.89, -0.47), uninteresting tasks gave a non-significant d = 0.18 (CI = -0.03, 0.39). On self-report, interesting d = -0.37, uninteresting d = 0.10 and not significant. Rewards for a chore are not the overjustification case. There is nothing there to undermine, and Cameron, Banko and Pierce found enhancement.
- The reward has to be expected and tied to the activity. Unexpected rewards were null in both meta-analyses (d = 0.01 and d = -0.04); rewards not contingent on doing the task were null in both (d = -0.14 and d = 0.10). The undermining comes from the announcement, not the payment. Deci and colleagues add the obvious caveat on exploiting that: people begin to expect the unexpected rewards if they are given often.
- Tangible beats verbal in the wrong direction. Praise enhanced free-choice behaviour and interest; tokens, money and prizes reduced free-choice behaviour. But praise only works while it stays informational. Across four studies that included both styles, controllingly administered positive feedback came out d = -0.78 (CI = -1.02, -0.54) relative to informational feedback; against a no-feedback control, informational praise gave d = 0.66 (CI = 0.28, 1.03) and controlling praise gave d = -0.44 (CI = -0.82, -0.07). Praise that carries an instruction to keep performing is not on the enhancing side of the ledger.
- The worst configuration is the common one. Within performance-contingent rewards, Deci and colleagues separated four cases. Maximum rewards for everyone against a no-feedback control gave d = -0.15 (CI = -0.31, -0.00). Less-than-maximum rewards — the structure where you get a bigger payout for better performance and most people fall short — gave d = -0.80 (CI = -1.03, -0.57), and d = -0.88 (CI = -1.12, -0.65) with one outlier removed. That is the largest undermining effect of any reward category in the analysis, and chi-square tests showed it to be worse than each of the other three. Rewards signifying good performance against a control that received the same positive feedback still gave d = -0.20 (CI = -0.37, -0.03): the reward, over and above the competence information, costs you something.
- Age moderates it. Tangible rewards on free-choice behaviour gave d = -0.39 (CI = -0.47, -0.32) for children and d = -0.27 (CI = -0.36, -0.19) for college students. Verbal rewards enhanced free choice for college students, d = 0.43 (CI = 0.27, 0.58), but not for children, d = 0.11 (CI = -0.11, 0.34). If your users are children, tangible rewards are more costly and praise buys you less.
- How visible the reward is may matter, on thin data. Two studies from one 1975 article varied reward salience; combined, salient rewards gave d = -0.78 (CI = -1.59, -0.30) and non-salient d = 0.24 (CI = -0.23, 0.71). Two studies is two studies, but the direction is consistent with the mechanism, and it is the only handle the literature offers on the difference between a reward you are reminded of constantly and one you are not.
- It is weakest where most products operate. In real work settings, the pooled observational association is null, and the one negative signal attaches to performance-based rewards perceived as controlling. Cerasoli and colleagues found intrinsic motivation remains predictive of performance whether or not incentives are present. And the only interface experiment in this set found no effect on intrinsic motivation at all. Treat the lab effect as a reason to be careful about which behaviours you attach rewards to, not as a prediction that your points will destroy engagement.
- It only shows up if you measure the right thing. Free-choice behaviour after withdrawal is where the effect lives: d = -0.24 for all rewards. Self-reported interest was d = 0.04 and not significant. A satisfaction survey will tell you nothing about it.
How to apply
- Sort your behaviours first. For each action you are considering rewarding, ask whether users already do it unprompted. If yes, it is in the high-interest category where tangible, expected, contingent rewards do their damage. If it is a chore nobody enjoys — verifying an address, completing compliance training, migrating data — reward it freely; the evidence shows no undermining for low-interest tasks and some enhancement.
- For behaviour people already enjoy, reward informationally rather than transactionally. Tell the person what they did and what it produced: the answer you wrote helped 14 people, your draft is now three chapters long, this is your most detailed entry yet. That is the competence information that carried d = 0.33, without the contingency that carried d = -0.40.
- Strip control language out of praise. “Nice work, exactly what we need from you, keep it up” is the controlling form that measured d = -0.44 against no feedback at all. “Nice work — your summary covered every section” is the informational form that measured d = 0.66.
- Use intrinsic framing in the copy around the action. Name what the activity gives the user, not what the system will pay them for it. A prompt that leads with the reward makes the reward the reason.
- If you reward, prefer unexpected and retrospective. A thank-you that arrives after the fact, unannounced, was null in both meta-analyses. Announce it in advance and you have built the expected-contingent case. Do not let it become a schedule: once users can predict the surprise, it is expected.
- Prefer task-noncontingent perks to per-action currency. A benefit that comes with being a member — storage, access, a discount — behaves like salary: null in the lab, positively associated with intrinsic work motivation in the field (r = 0.19). Points priced per comment, per lesson or per post are engagement-contingent, the worst-performing contingency.
- If you must run a tiered reward, set the bar where everyone who participates clears it. Rewards that most entrants fail to maximise produced d = -0.88. A flat completion reward, or no reward, beats a graded one on this measure.
- Design the withdrawal before you launch. The effect is defined on behaviour after the reward stops, so assume the programme ends and ask what the baseline looks like then. If the answer is that you can never turn it off, you have bought a behaviour rather than motivated one.
- Make any points you already have readable as a record rather than a currency. A counter that summarises what you did is informational; the same counter with an exchange rate attached is a price on the activity.
- Keep the boundary with variable reward clear. That principle is about making a reward uncertain. This one is about whether to attach a reward at all, and to which behaviour. Deciding the schedule before deciding the target is the common mistake.
- For products used by children, lean on feedback and avoid tangible rewards for liked activities: tangible rewards were more detrimental for children, and praise was not reliably enhancing for them.
What to avoid
- Points and badges for everything. The anti-pattern is applying one reward layer across every action regardless of whether users enjoy it, which guarantees that the layer lands on the behaviours where it costs you. The measured outcome of a generic points-levels-leaderboard layer, in the one controlled interface experiment here, was more output (d = .44 for points over control) with no change in quality and no change in intrinsic motivation. You are buying volume.
- Incentivising a behaviour whose value is its quality. Intrinsic motivation predicted unique variance in quality; incentives predicted quantity. Reviews, community answers, moderation, documentation and code review are quality goods; paying by the unit reliably gets you more units and tells you nothing about whether they are any good.
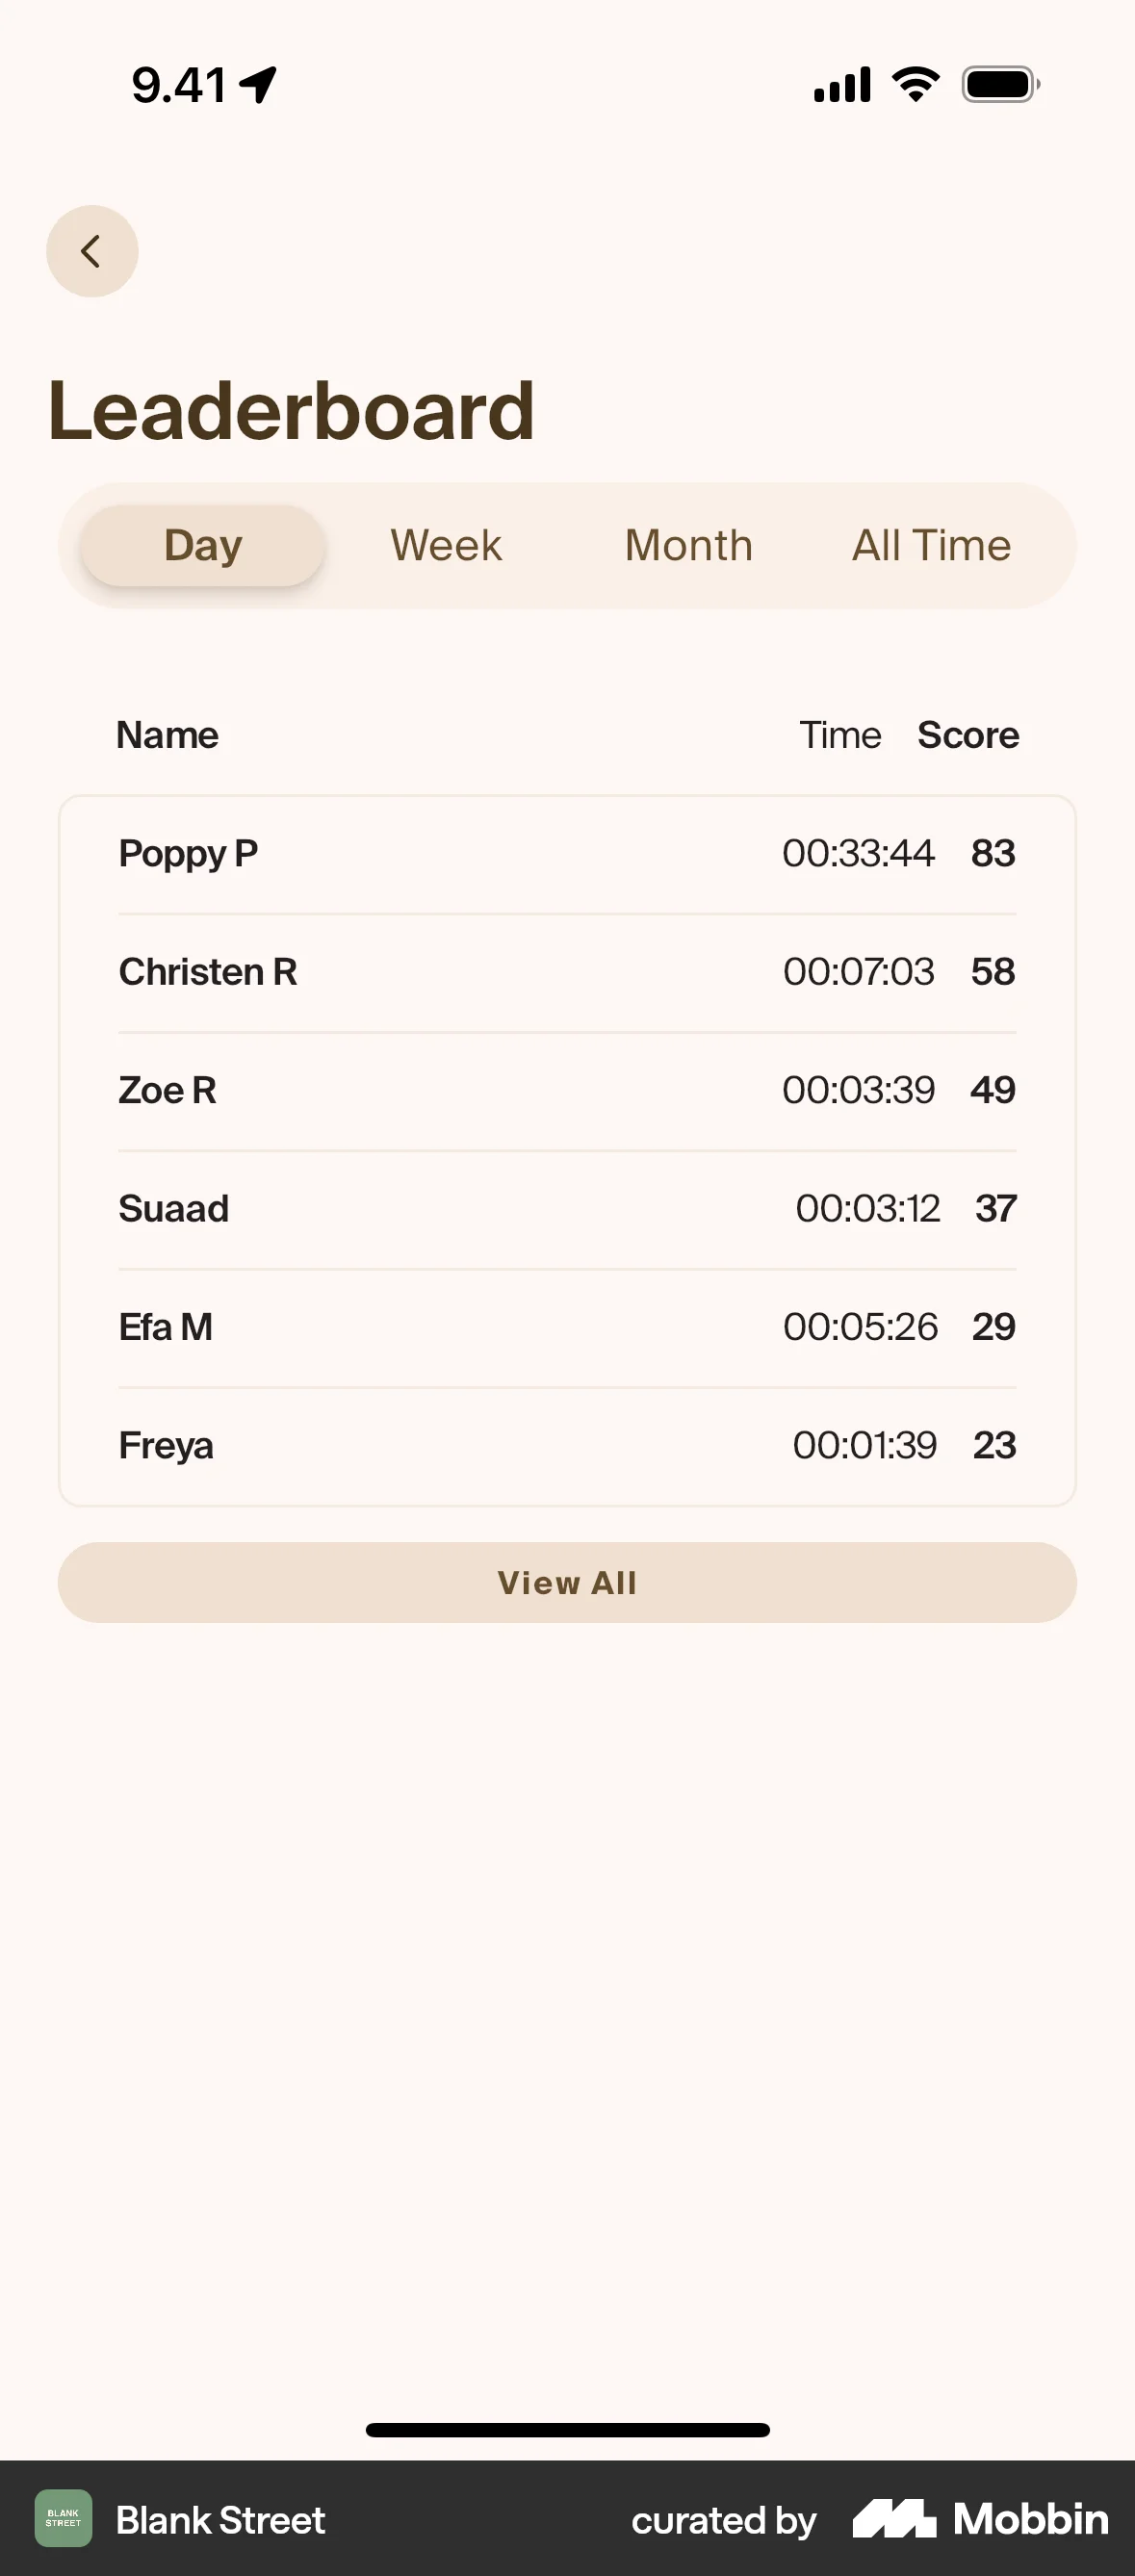
- Leaderboards that pay the top ranks. By construction, most participants receive less than the maximum reward for their performance — the configuration with the largest undermining effect in the literature, d = -0.88. A leaderboard as pure information is a different object from a leaderboard with prizes attached.
- Praise as a lever. Positive feedback used to steer behaviour, rather than to report it, measured as undermining relative to no feedback.
- Rewarding reviews, which is also a legal line in the United States. 16 CFR 465.4, effective 21 October 2024, makes it an unfair or deceptive act or practice for a business to provide compensation or other incentives in exchange for, or conditioned expressly or by implication on, the writing or creation of consumer reviews expressing a particular sentiment, whether positive or negative, regarding the product, service or business that is the subject of the review. Points for a five-star rating are both the anti-pattern and a rule violation.
- Treating a lift during the reward period as proof the reward worked. The token-economy field study produced a clear reinforcement effect in every treated group and a drop below baseline after withdrawal in all three. The two results are compatible, and only one of them is in your launch dashboard.
- The ethical line: protect intrinsic motivation instead of replacing it. If removing the reward would stop the behaviour, the reward has become the motive, and you have made the activity worth less to the person than it was before you arrived.
Real-world examples


Measuring it
- The metric that would show it worked: unrewarded free-choice engagement. Run a period or a holdout where no reward is attached and measure the share of users who perform the behaviour anyway. That is the measure the entire literature is built on.
- The metric that would show it backfired: post-withdrawal volume below the pre-programme baseline, not merely below the rewarded peak. That is the token-economy signature.
- Watch quality against quantity on the same action. Volume up with per-item quality flat or down is the incentive-salience pattern Cerasoli and colleagues predict, and the Mekler result exactly.
- Count the share of participants who do not reach the top reward tier. If it is most of them, you are running the d = -0.88 configuration.
- Do not rely on surveys. Self-reported interest moved d = 0.04 across 84 studies. The effect is behavioural.
References
- Deci, Koestner & Ryan (1999). A Meta-Analytic Review of Experiments Examining the Effects of Extrinsic Rewards on Intrinsic Motivation. Psychological Bulletin.
- Cameron, Banko & Pierce (2001). Pervasive Negative Effects of Rewards on Intrinsic Motivation: The Myth Continues. The Behavior Analyst.
- Cameron & Pierce (1994). Reinforcement, Reward, and Intrinsic Motivation: A Meta-Analysis. Review of Educational Research.
- Lehtivuori (2023). When Do Extrinsic Rewards Undermine Intrinsic Motivation? A Meta-Analysis. Doctoral dissertation, Turku School of Economics.
- Greene, Sternberg & Lepper (1976). Overjustification in a Token Economy. Journal of Personality and Social Psychology.
- Murayama, Matsumoto, Izuma & Matsumoto (2010). Neural Basis of the Undermining Effect of Monetary Reward on Intrinsic Motivation. Proceedings of the National Academy of Sciences.
- Cerasoli, Nicklin & Ford (2014). Intrinsic Motivation and Extrinsic Incentives Jointly Predict Performance: A 40-Year Meta-Analysis. Psychological Bulletin.
- Mekler, Brühlmann, Tuch & Opwis (2017). Towards Understanding the Effects of Individual Gamification Elements on Intrinsic Motivation and Performance. Computers in Human Behavior.
- Federal Trade Commission (2024). Trade Regulation Rule on the Use of Consumer Reviews and Testimonials, 16 CFR Part 465, effective 21 October 2024.
For agents
An agent-friendly guide to this principle lives at /agents/overjustification-effect.md.
Our MCP server and skills for all principles are coming soon.
Similar principles
Disclaimer: The theories here are just that — theories. They may not apply universally and should be considered in context. Use your own judgment and consult additional sources when applying these principles.