Scarcity
Scarcity is the tendency to read limited availability as a signal — of quality, of popularity, or of exclusivity — and to raise the value of the thing accordingly. It is a cue about the product, which is why a cue that is not true stops working once people notice.
Barton, Zlatevska and Oppewal pooled 416 effect sizes from 131 studies. Scarcity cues raise purchase intentions by δ = 0.31, and move the inferences behind that more: willingness to pay 0.47, perceived quality 0.47, perceived value 0.37, perceived popularity 0.71 — while attitude towards the product shifts by only 0.15. Lynn's earlier review of the commodity-theory literature put scarcity's effect on perceived value at r = 0.12, with wide variation between studies. The direction is consistent and the size is modest: a scarcity cue is worth a few percent on a page, not a redesign around it.
Which cause you name matters less than the folk version claims. Supply-based scarcity (few were made) moved purchase intentions most at δ = 0.39, time-based (the offer ends) 0.34 and demand-based (many were sold) least at 0.28, and the three were not significantly different (Q(2) = 1.76, p = .414). The paper's abstract still offers a frame-per-product rule — demand for utilitarian products, supply for experiences, time limits for high involvement — and only the first of the three cleared its own test: among utilitarian products demand framing returned δ = 0.41 against −0.02 for supply and 0.02 for time (Q(2) = 12.38, p < .01). The other two rest on marginal omnibus tests (experiences p = .083, high involvement p = .060) in which supply framing beat demand framing but could not be separated from a deadline, and for material goods and low-involvement products the framings did not differ at all. The product mattered more than the frame: low-familiarity brands showed about twice the effect of high-familiarity ones (δ = 0.41 against 0.21) and high-involvement products more than low (0.38 against 0.28). Discount figures from within-subjects designs: they returned δ = 0.48 against 0.11 for mixed designs.
The honest limit is what was measured. Of the 416 effect sizes, 384 came from hypothetical situations; only 24 measured actual behaviour and only 6 came from field studies. The country spread is uncomfortable too: δ = 0.70 in Korea, 0.49 in Canada, 0.28 in the USA, 0.27 in Taiwan, and non-significant in both Germany (0.05) and the Netherlands (0.19). Treat the pooled figures as a direction worth testing on your own interface, not as a lift to forecast.
The cleanest evidence from a live interface is a randomised field experiment on Amazon lightning deals, which display the share of inventory already claimed as a bar. Cui, Zhang and Bassamboo spiked that bar by adding items to carts, raising the claimed figure by an average 16.48 percentage points, and measured 3.42% more cart add-ins over the next hour — a 2.08% increase per 10% rise in the bar. The treated deals were far from stockout, so the mechanism is mostly observational learning from other buyers, and the authors write that they “cannot completely disentangle the herding effect from the scarcity effect.” A progress bar on a deal is as much social proof as scarcity, and it buys single digits.
Involvement in the category decides whether the cue lands at all. Van Herpen, Pieters and Zeelenberg showed participants a shelf holding one fully stocked wine and one barely stocked one, the gap explained as either high demand or limited production. The scarce wine won overall — preference 6.06 against 5.60, and 185 of 276 participants, 67%, chose it — but uninvolved participants showed none of the predicted pattern, and among involved ones the supply-caused version only worked for those with a high need to be unique in creative ways, while demand-caused scarcity worked regardless. As they put it, the scarcity principle “has been observed in various contexts, and thus seems universal, but it is not.” The spoken explanation changed nothing on its own, because the empty facing had already said it. A screen has no empty facing, so the sentence is the only cue there is.
The mechanism usually asserted for deadlines — that urgency degrades deliberation — did not appear in the one carefully incentivised test of it. Sugden, Wang and Zizzo ran price-search tasks against matched, untimed lottery choices: no regret effects, time-limited offers more likely to be accepted when more time was available rather than less, and timed choices consistent with their untimed equivalents. Their own conclusion is that the gain to retailers comes “not by using time constraints to impair the rationality of consumers' decision-making” but from search deterrence — “a restriction of consumers' opportunities to compare available offers” — amplified by ordinary risk aversion, with subjects taking the offer at a standardised probability of 0.590 and 0.645 where a risk-neutral agent would have been indifferent. The CMA's 2022 online choice architecture paper reads the same study as evidence of harm: that buyers who took timed deals “ended up worse off than those who waited” and that “participants' behaviour did not improve with experience.” The first is the search-deterrence result restated; the second sits awkwardly beside the article, which reports no trend across tasks but a highly significant effect of previously seen good offers on willingness to accept. Harm claims are shakier still: Kristofferson and colleagues' finding that limited-quantity promotions induce aggression failed to replicate in O'Donnell and colleagues' PNAS audit, with no effect on perceived threat and none of the promotion itself. A countdown has no documented power to switch off deliberation, so it has nothing to earn beyond telling the truth about a deadline.
What actually ships is largely unverifiable. Mathur and colleagues crawled about 53,000 product pages across roughly 11,000 shopping sites and found 632 low-stock messages, 49 of them with no number at all, 47 high-demand messages of which 38 appeared regardless of which product was shown, and 393 countdown timers. Where deception could be proved, it was: 157 timer instances reset or vanished with the offer still valid, and 17 low-stock messages were fabricated — 16 decrementing on a deterministic schedule, one generating values at random on page load, 8 of the 17 using off-the-shelf Shopify plugins built for the purpose — and the detection method was a lower bound by construction. The EU's Consumer Protection Cooperation Network screened 399 online shops in 2023 and found 148 carrying at least one of three dark patterns, 42 of them fake countdown timers. The CMA's assessment of the long-run cost is the one to keep: false scarcity claims “can damage trust in markets because consumers will learn to ignore these claims, meaning that when a product is truly scarce, the seller will not be able to credibly communicate this information.” One fabricated figure converts a modest, conditional, real effect into legal exposure and a dead signal.
When it holds
- Only when the figure is true. The effect is an inference about the product, and the EU sweep, Mathur's crawl and the undertakings the CMA took from six hotel booking platforms all describe markets where the inference has already been poisoned — once users expect the number to be invented, there is nothing left to infer.
- Mostly in stated intention rather than measured behaviour. Of 416 effect sizes in the meta-analysis, 24 measured actual behaviour and 6 came from field studies; 384 measured hypothetical situations.
- Where involvement in the category is high. Involved wine buyers showed the predicted preference pattern and uninvolved ones did not, and high-involvement products in the meta-analysis returned δ = 0.38 against 0.28 for low.
- More for unfamiliar brands and new products. Low brand familiarity showed about twice the effect on purchase intentions of high familiarity, δ = 0.41 against 0.21 — the cue substitutes for a reputation the buyer does not have.
- Roughly equally whichever cause you name. Supply-based δ = 0.39, time-based 0.34, demand-based 0.28, and the three were not significantly different overall (Q(2) = 1.76, p = .414). The one frame-by-product contrast that cleared its own test was demand framing for utilitarian products, δ = 0.41 against −0.02 for supply and 0.02 for time; the experience and high-involvement tests were only marginal and never separated a deadline from supply framing.
- Not reliably outside the lab's culture. The same meta-analysis found non-significant effects in Germany (δ = 0.05) and the Netherlands (0.19) against 0.70 in Korea and 0.28 in the USA.
- At a small magnitude on a live interface. A 16.48 percentage-point jump in Amazon's claimed-inventory bar bought 3.42% more cart add-ins in the next hour; a 10% rise in the bar, 2.08%.
- Partly as social proof, not scarcity. Cui and colleagues' experiment ran well away from stockout, so its effect is mostly herding, and they state they cannot fully separate the two.
- Not through time pressure wrecking the decision. In Sugden, Wang and Zizzo's experiment there were no regret effects, time-limited offers were accepted more when more time was available, and timed choices stayed consistent with untimed ones.
How to apply
- Read the number off inventory and show it as an integer at the point of decision — next to the price and the buy button, not in a banner. A count can be checked against what the user sees next; “limited quantities left” cannot.
- Set a threshold below which the badge appears, and render nothing above it. A low-stock line on every row carries no information, and a message that appears whichever product is shown is the fabricated version of the pattern.
- State why availability is limited — few were made, or many were sold — because a list view has no empty shelf facing to say it for you. On a screen the sentence is the whole cue.
- Use the one frame the meta-analysis separated: on a utilitarian repeat purchase, say how many others bought it, where demand framing returned δ = 0.41 against roughly zero for supply and time framing. Everywhere else the three framings were statistically indistinguishable, so pick whichever is true of your inventory — how few exist, or when the offer ends — and test it rather than inheriting a rule.
- Drive a deadline from a server-side timestamp, show one timer per offer, and let the price go back up when it expires. If the offer will be repeated next month, say that it runs monthly instead of counting down to nothing.
- In onboarding, show remaining seats, slots or cohort places only where the cap is enforced in the system that allocates them, and close the form when it is reached. A seat counter that never reaches zero is a lie with a number in it.
- Put a back-in-stock alert, a saved cart or a waitlist beside the cue so the route is not “buy now or lose it.” Scarcity's defensible job is preventing a decided buyer from drifting, not compressing an undecided one.
- Restrict the cue to new SKUs, unfamiliar brands and genuinely small production runs rather than spreading it across a catalogue of restockable items — that is where the larger effects sit and the credibility cost is lowest.
What to avoid
- Inventing the figure, in any form. No low-stock count, viewer count, “selling fast” badge, seat counter or countdown that is not read from real inventory or a real clock. This repo forbids fabricated scarcity outright: if the data is not wired up yet, ship a placeholder that makes obvious real data is required, and ship no number.
- Timers that reset. UCPD Annex I No. 7 bans “Falsely stating that a product will only be available for a very limited time, or that it will only be available on particular terms for a very limited time, in order to elicit an immediate decision and deprive consumers of sufficient opportunity or time to make an informed choice”; the UK's version in Schedule 20 paragraph 7 of the Digital Markets, Competition and Consumers Act 2024, in force since 6 April 2025, drops the word “very” and so bites harder. The FTC's staff report names the same two things as the Baseless Countdown Timer and the False Limited Time Message.
- Stock numbers generated by a schedule or a random function, including by an off-the-shelf plugin that sells it as a feature. The FTC lists False Low Stock Message (“Only 1 left in stock – order soon”) and False High Demand Message as dark patterns in their own right.
- Counting something other than what the sentence says. Six hotel booking platforms gave the CMA undertakings on 6 February 2019, with the changes due by 1 September 2019: to give no false impression of a hotel's availability or popularity, to make clear that the other customers behind an “other customers are looking at the same hotel as you” claim may be searching different dates, and to stop placing sold-out hotels in search results to hurry bookings. What that establishes is the commitment, not the breach — the CMA “has not made a finding on whether the hotel booking sites' practices have breached consumer law,” and states that “the provision of undertakings is not an admission of a breach of the law.”
- Using the cue to rush a decision the user has not made yet, or one that is hard to undo. That is precisely the harm Annex I No. 7 describes, and for online platforms Article 25(1) of the Digital Services Act separately prohibits interfaces that “deceive or manipulate” recipients or otherwise “materially distort or impair” their ability to make free and informed decisions.
- Reading a lift in stated intent as a result. The literature's δ = 0.31 is almost entirely hypothetical intention; the field estimate on a live interface is a couple of percent of cart add-ins. Measure orders.
- Running it everywhere because it is cheap. The cost lands on the signal itself: users learn to ignore the claim, and then the one time stock really is down to two you have no way left to say so.
Real-world examples
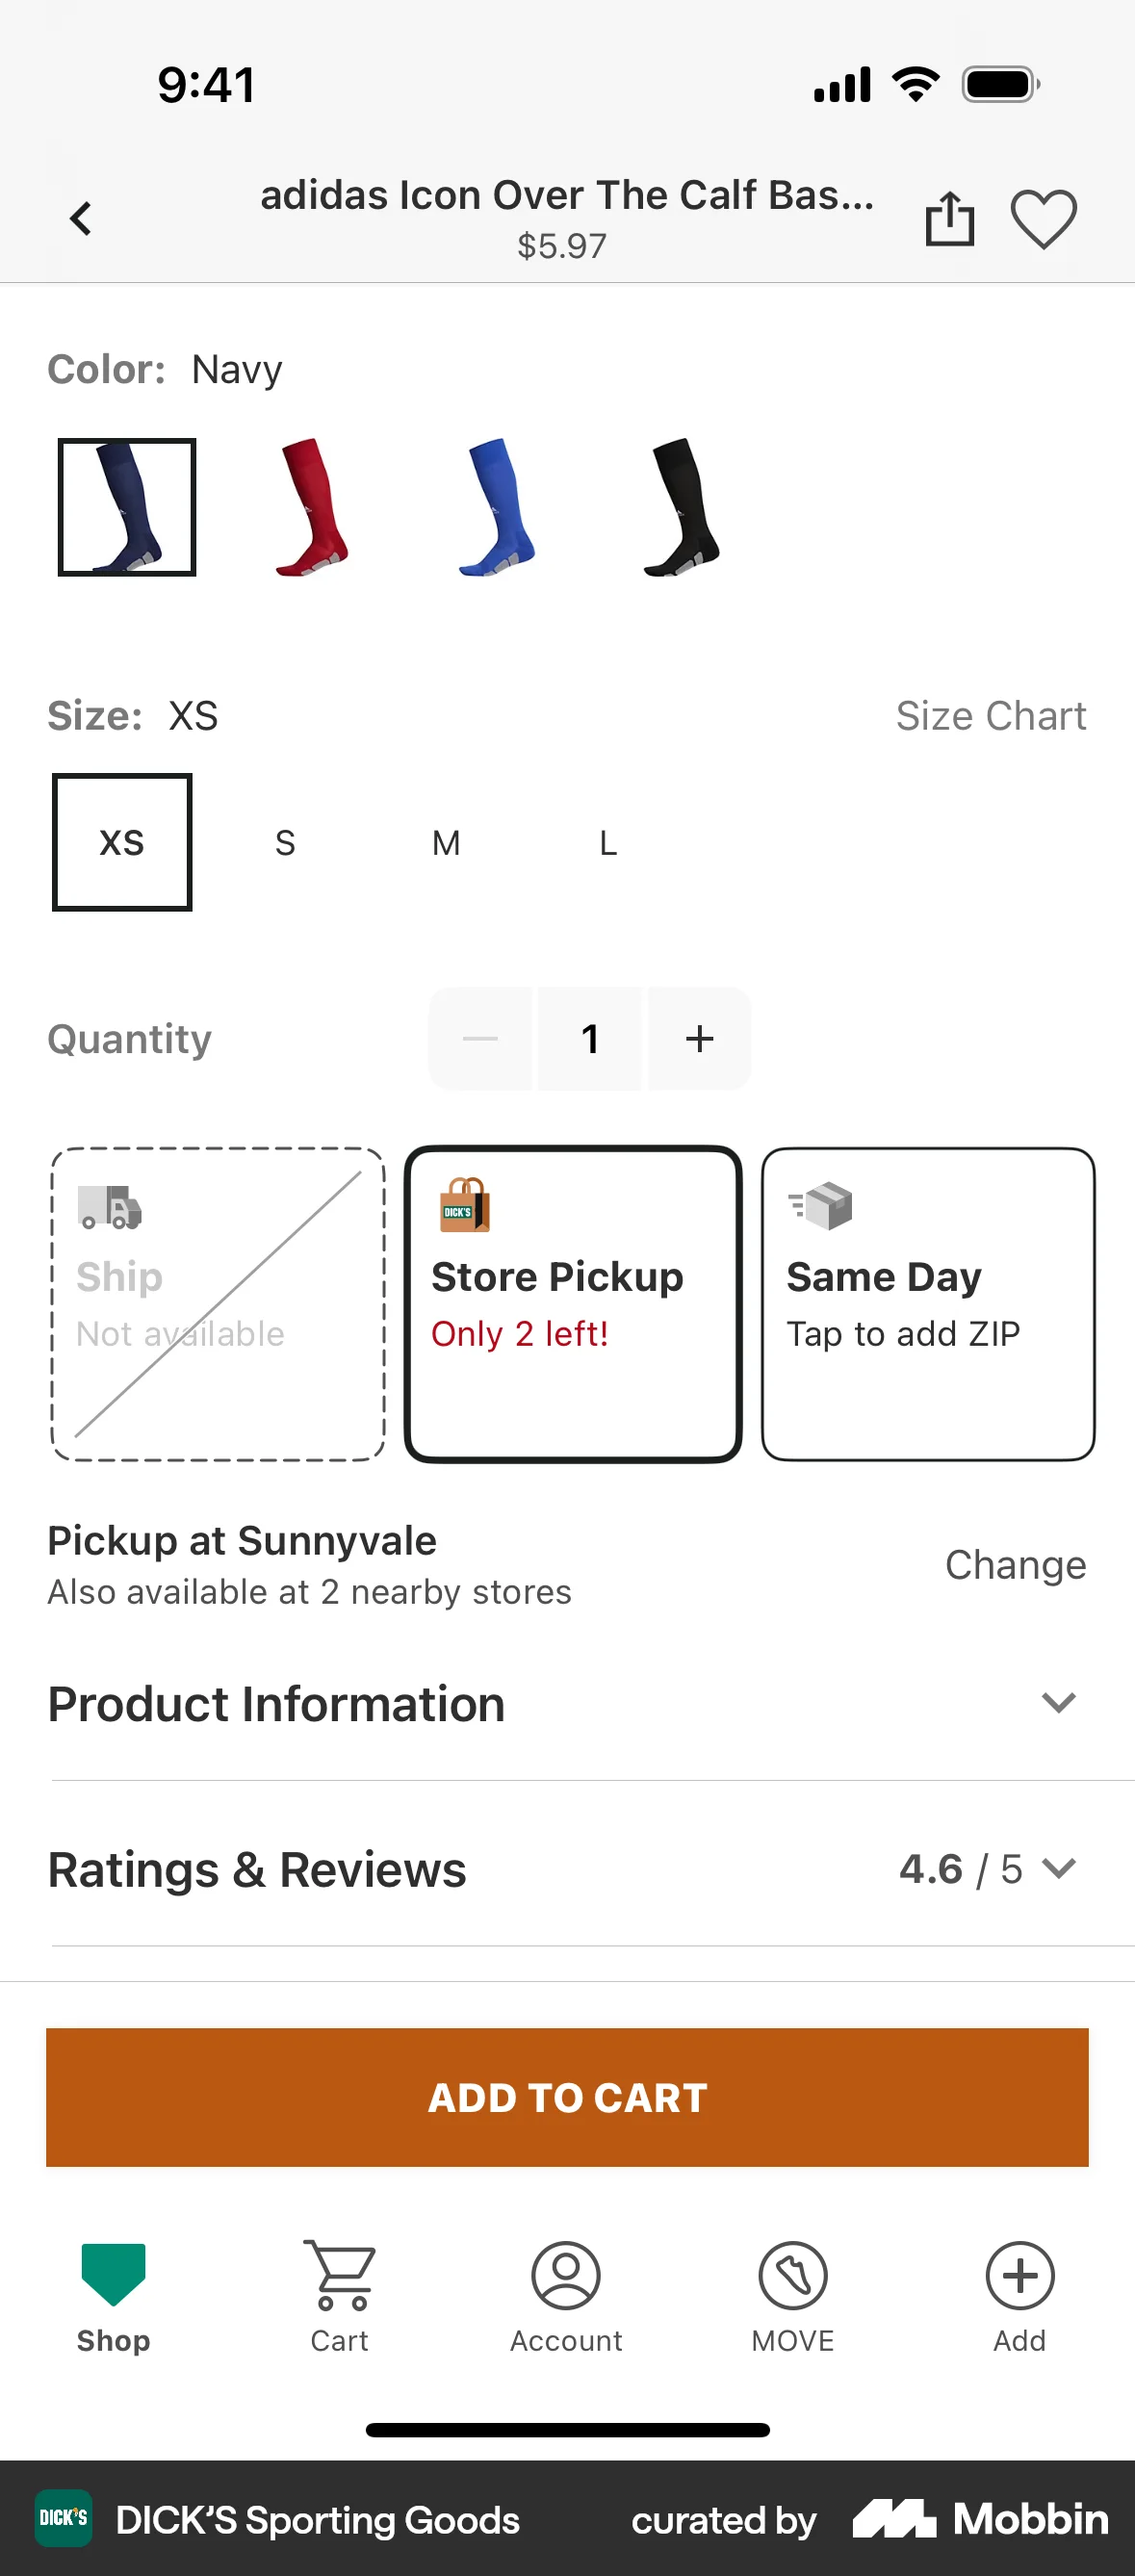
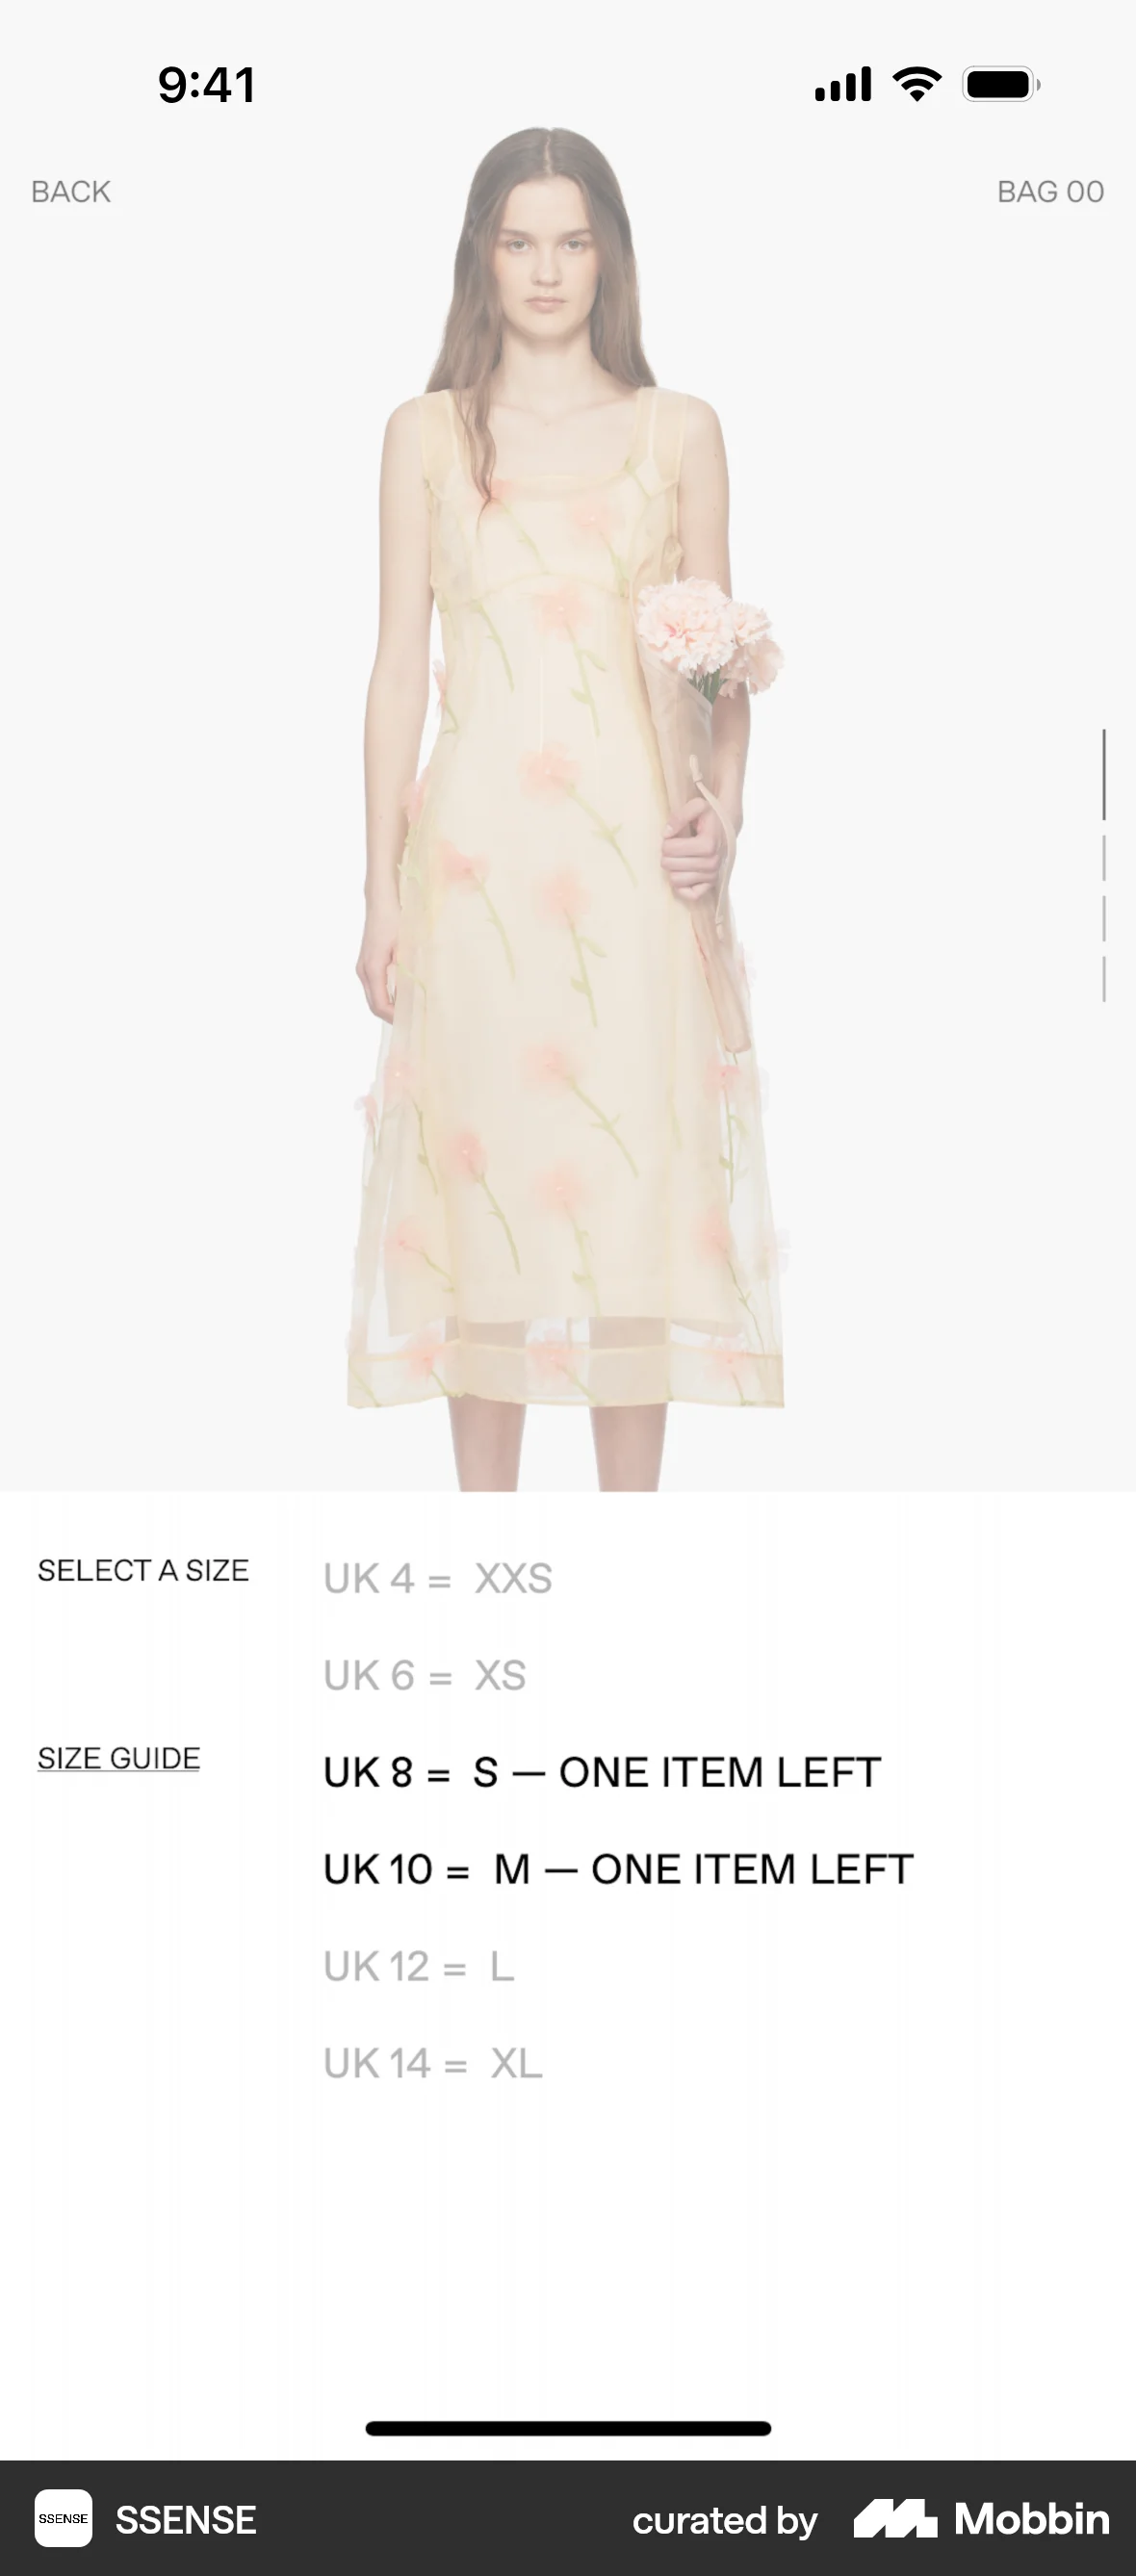
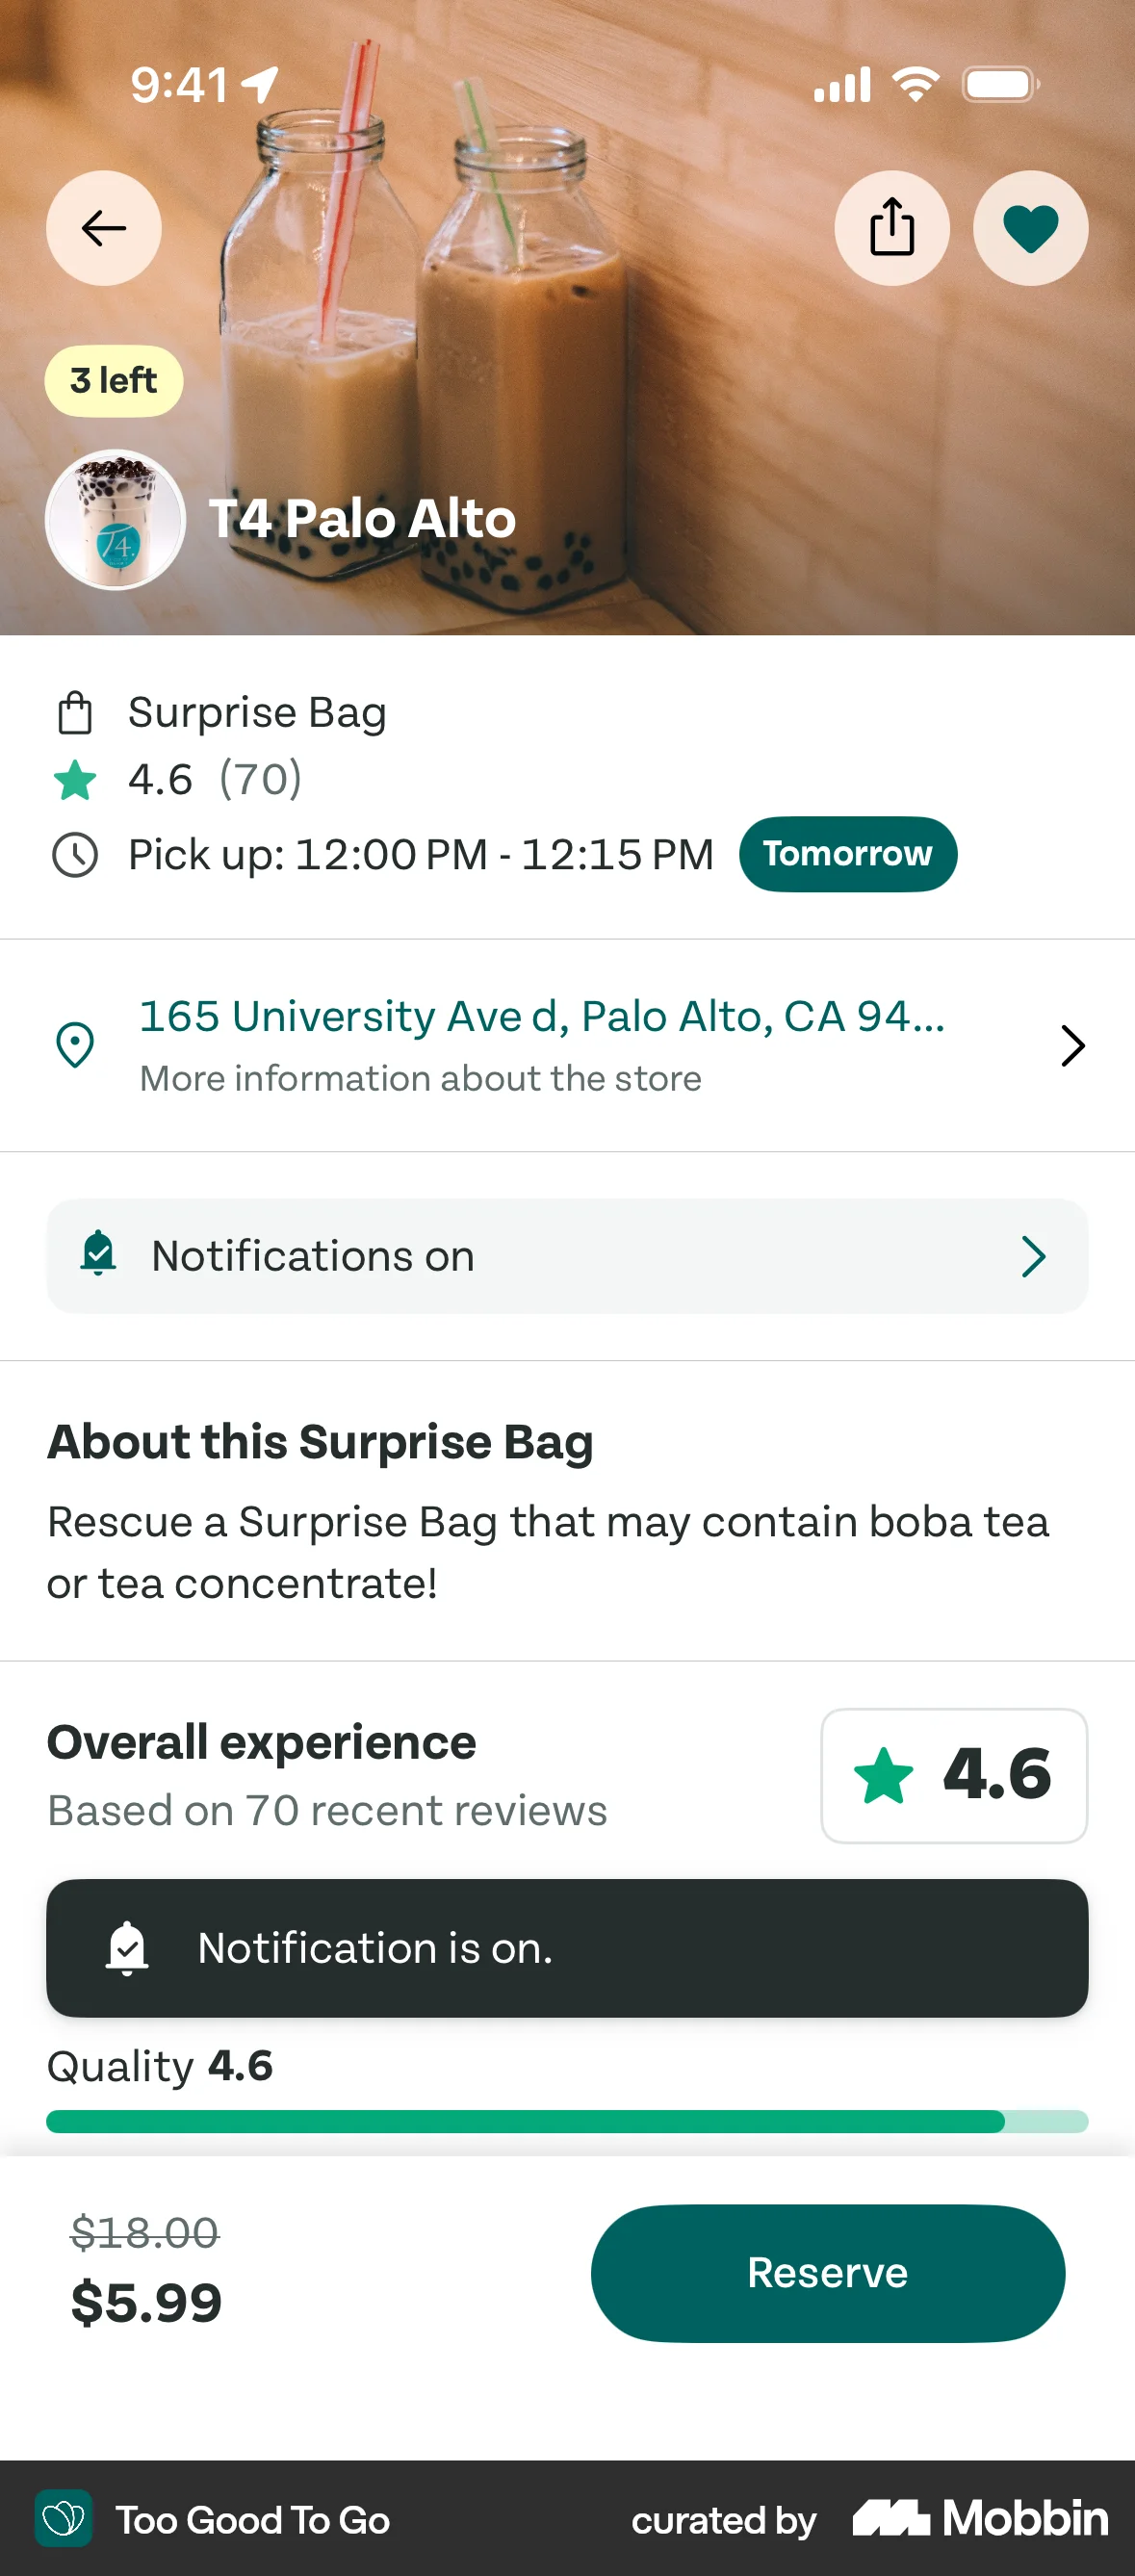

Measuring it
- Primary metric: completed orders on pages carrying the real cue against a held-out control, not add-to-cart and not survey intent. The field estimate to beat is small — a 10% move in Amazon's claimed-inventory bar bought 2.08% more cart add-ins — so size the test for a few percent, not for a headline.
- Secondary: abandonment and time-to-decision at the step where the cue appears, split by new versus returning users and by whether the item is a first purchase in the category. The meta-analysis predicts roughly double the effect for unfamiliar brands, so a flat average will hide where it works.
- Backfire metric: returns, cancellations and refunds inside the window the cue created. An effect that only pulls regretted purchases forward shows up here and nowhere else.
- Backfire metric: cue-to-truth mismatches, audited continuously. Count displayed figures that disagree with inventory, badges rendered above your own threshold, and timers that expire with the offer still live. Treat any non-zero rate as a defect and a compliance incident, not as noise — this is the measure that catches a vendor plugin inventing numbers on your behalf.
- Backfire metric: credibility decay and trust signals — conversion on the cue by how many times a user has already seen it, complaints naming the badge, reviews mentioning pressure, and unsubscribe or uninstall rates after a scarcity-heavy campaign. The weakest pooled effect of all is on attitude towards the product (δ = 0.15), so there is little upside here to offset a loss.
References
- Barton, Zlatevska & Oppewal (2022). Scarcity tactics in marketing: a meta-analysis of product scarcity effects on consumer purchase intentions. Journal of Retailing.
- Lynn (1991). Scarcity effects on value: a quantitative review of the commodity theory literature. Psychology & Marketing.
- Cui, Zhang & Bassamboo (2019). Learning from inventory availability information: evidence from field experiments on Amazon. Management Science.
- van Herpen, Pieters & Zeelenberg (2014). When less sells more or less: the scarcity principle in wine choice. Food Quality and Preference.
- van Herpen, Pieters & Zeelenberg (2009). When demand accelerates demand: trailing the bandwagon. Journal of Consumer Psychology.
- Sugden, Wang & Zizzo (2019). Take it or leave it: experimental evidence on the effect of time-limited offers on consumer behaviour. Journal of Economic Behavior and Organization.
- Kristofferson, McFerran, Morales & Dahl (2017). The dark side of scarcity promotions: how exposure to limited-quantity promotions can induce aggression. Journal of Consumer Research.
- O'Donnell et al. (2021). Empirical audit and review and an assessment of evidentiary value in research on the psychological consequences of scarcity. PNAS.
- Mathur, Acar, Friedman, Lucherini, Mayer, Chetty & Narayanan (2019). Dark patterns at scale: findings from a crawl of 11K shopping websites. Proceedings of the ACM on Human-Computer Interaction.
- CMA (2022). Online choice architecture: how digital design can harm competition and consumers, section 4.6–4.12 and case study 1.
- CMA (2019). Online hotel booking: undertakings and principles. Case page.
- CMA (2019). Hotel booking sites to make major changes after CMA probe. Press release, 6 February 2019.
- Unfair Commercial Practices Directive 2005/29/EC, Annex I No. 7 (false claims of very limited availability).
- Digital Markets, Competition and Consumers Act 2024, Schedule 20 paragraph 7 (banned practices).
- Digital Services Act, Regulation (EU) 2022/2065, Article 25 (online interface design and organisation).
- FTC (2022). Bringing dark patterns to light. Staff report.
- European Commission (2023). Consumer protection: manipulative online practices found on 148 out of 399 online shops screened. Press release IP/23/418.
For agents
An agent-friendly guide to this principle lives at /agents/scarcity.md.
Our MCP server and skills for all principles are coming soon.
Similar principles
Disclaimer: The theories here are just that — theories. They may not apply universally and should be considered in context. Use your own judgment and consult additional sources when applying these principles.