Loss aversion
People judge outcomes as deviations from a reference point, and prospect theory's value function is steeper below that point than above it. How steep is the loss aversion coefficient, λ.
Loss aversion is the reference-dependence half of prospect theory. Kahneman and Tversky (1979) modelled people as judging outcomes not as final states of wealth but as deviations from a reference point, with a value function steeper below that point than above it; their anchor for the asymmetry was that most people find a symmetric coin-flip bet to win or lose the same amount distinctly unattractive. The steepness ratio is the loss aversion coefficient, λ, and at λ = 2 a loss moves the valuation about twice as far as a gain of the same size. Tversky and Kahneman (1992) put it at 2.25. What matters for an interface is the reference point rather than the ratio: nothing is a loss until something counts as already held. Progress shown as earned, data shown as saved, a workspace shown as configured, a bonus shown as allocated up front — each moves the reference point so that inaction reads as giving something up. The decision in front of you is what the user already owns on this screen, not which verb goes in the headline.
Three mechanisms compete to explain the same behaviour and each predicts something different for a build. Reference-dependent valuation says the loss itself carries extra weight. A preference for inaction says the effect is mostly a pull toward the status quo, which in software you supply yourself through defaults. Loss attention says losses recruit attention rather than aversion: Yechiam and Hochman (2013) model losses as increasing on-task attention and find distinct effects of losses on performance, arousal, frontal cortical activation and behavioural consistency even where no behavioural loss aversion appears, which predicts more careful behaviour rather than avoidance. The applied record fits a mix of all three, so expect a loss-framed screen to move inertia and attention as much as valuation.
The headline coefficient has one tight estimate and one that contradicts it. Brown, Imai, Vieider and Camerer (2024) pooled 607 estimates of λ from 150 articles published between 1992 and 2017 across economics, psychology and neuroscience: the mean was 1.955, with a 95 percent probability that the true value falls between 1.820 and 2.102, and few observable study-design characteristics correlated substantially with differences in the mean. That is the strongest support the familiar “about twice” shorthand has, and it sits slightly below the 2.25 of 1992. Walasek, Mullett and Stewart (2024) restricted their meta-analysis to the task λ was defined on — prospect theory fitted to individual choices between mixed risky prospects — and found a small λ of 1.31, 95% CI [1.10, 1.53], alongside the observations that few studies have run that task and that much of the available data is too poor to estimate the parameters precisely. In the earlier working-paper version of that analysis, only six of 19 included studies observed significant loss aversion (as summarised by Zeif and Yechiam 2022). The gap between 1.31 and 1.955 comes from different literatures, elicitation tasks and model versions rather than an error on either side, so neither number sizes a design for you.
The critique is broader than the coefficient. Gal and Rucker (2018) separate a strong form, in which losses always loom larger, a weak form, in which they do so on balance, and a contextual form, in which the direction depends on context; they reject the first two, concluding that current evidence does not support losses being, on balance, any more impactful than gains, and note that loss aversion and the endowment effect are routinely used to explain each other. Gal (2006) had already shown that a propensity toward the status quo is sufficient to account for the three anomalies loss aversion was introduced to explain — the risky bet premium, the endowment effect and status quo bias — and in an interface that propensity is your default. Plott and Zeiler (2005) could turn the willingness-to-pay/willingness-to-accept gap for goods such as mugs on and off by controlling for subjects' misconceptions about the elicitation procedure. Yechiam (2019) finds that the early utility studies cited as the original evidence showed overweighting of very large losses but often not of smaller ones, and that some of those findings were later misrepresented. Treat an endowment-framed screen as a hypothesis to test, not a known lift.
The defence is empirically serious too. Mrkva, Johnson, Gächter and Herrmann (2020) tested moderators across five samples totalling 17,720 people: people at every level of domain knowledge were loss averse, but more knowledge and experience went with less of it, car buyers were less loss averse on the particular attributes they knew well and not on others, and older consumers were more loss averse across measures and studies. They cast explicit doubt on the claim that loss aversion is a fallacy or is fully explained by status quo bias, risk aversion or educated lab samples. Zeif and Yechiam (2022) ran the sharper test: they reproduced Mrkva et al.'s result in its original paradigm, then re-ran the tasks with gains and losses presented symmetrically and in random order across five studies (n = 2,001) and found no loss aversion for small amounts, a mean λ of 1.16 for average losses of $40 and 1.54 for $100, and only a weak correlation between the endowment effect and loss aversion. Stake size, and the user's familiarity with it, decides whether there is an effect to design for at all.
Where the lever has actually been pulled in the field, it works, modestly and temporarily. Patel and colleagues (2016) randomised 281 overweight or obese employees to a 7,000-step daily goal with daily feedback and either no incentive, $1.40 for each day the goal was met, a lottery of the same expected value, or $42 allocated up front each month with $1.40 removed per missed day. The mean share of participant-days hitting the goal was 0.30 in control, 0.35 with the gain incentive, 0.36 with the lottery and 0.45 with the loss incentive; only the loss arm beat control in adjusted analysis, by 0.16 (CI 0.06 to 0.26, P = 0.001). Two limits travel with it: the adjusted difference in mean daily steps was not significant (861 steps, CI 24 to 1746, P = 0.056), and across the 13-week follow-up without incentives daily steps decreased in every incentive arm and none differed from control. Hossain and List (2012) found teams in a Chinese manufacturing facility responded more strongly to conditional bonuses framed as losses than to identical bonuses framed as gains, a framing effect worth roughly 1% of total team productivity. Fund the stake for as long as you want the behaviour, because in the trial the behaviour left when the money did.
Merkle (2020) surveyed investors at a large UK bank through the 2008–10 losses and found them about twice as sensitive to negative as to positive expected returns, with the asymmetry shrinking by more than half — to well below commonly reported coefficients — when they rated returns they had actually experienced. Much of financial loss aversion is an affective forecasting error about how bad the loss will feel, so a screen built on a threatened loss is working on an expectation users revise once they have lived through it.
When it holds
- Stake size is the first gate, and most product stakes fall below it. Symmetric tests found no loss aversion for small amounts, λ = 1.16 at average losses of $40 and 1.54 at $100 (Zeif and Yechiam 2022), so do not assume a 2:1 pain multiplier on a streak, a saved filter or a £4 discount.
- Your own option set can manufacture or erase the effect. Across seven experiments, acceptance of a mixed gamble was 32% when the safe option was framed as the status quo against 49% with abstract framing, and 34% when the surrounding options formed an unfavourable contrast set against 62% with a balanced set (Ert and Erev 2013).
- Stake size flipped the same Ert and Erev experiments in both directions: acceptance was 52–53% in the low-nominal-payoff condition, meaning no loss aversion, and 22% against 48% when real stakes were high rather than low. Long sequences without feedback also made loss-averse choices more likely, so a measured effect in your funnel can be an artifact of the set you showed.
- The reference point is context-dependent in ways you do not control. Walasek and Stewart (2019) shifted acceptance of mixed gambles by about .07 to .12 in area-under-the-curve terms by manipulating the range and skew of the amounts on display, but failed to replicate the full reversal reported in 2015 — in their own reanalysis it held in one of four experiments rather than three. Sensitivity to losses is partly relative to the other losses on display, so the same cancellation screen can read differently next to a different price list.
- Experience erodes it and age increases it (Mrkva et al. 2020). Expert users are both where the effect is weakest and the population most likely to be in your cancellation flow.
- Any screen where doing nothing is an option confounds loss aversion with plain inertia (Gal 2006), so an uplift you attribute to loss framing may belong to your default. Test against a gain-framed arm, not against nothing.
- Loss-framed copy is the weakest version of all of this and is not the same thing as a loss-framed stake. Across 93 studies (N = 21,656) of disease-prevention messages, gain-framed appeals were significantly more persuasive, with the difference tiny (r = .03) and concentrated in dental hygiene; safer sex, skin cancer prevention and diet showed no difference despite good statistical power (O'Keefe and Jensen 2007). Rewriting “Get 20% off” as “Don't lose 20% off” is not an evidence-backed change; giving someone $42 and taking $1.40 a day is.
How to apply
- Decide what the user owns before you decide what to say: credit progress, save the work, name the saved artifact and show its count. The reference point does the work, not the verb in the headline.
- Name the stake as a specific, countable thing — “23-day streak”, “14 saved recipes”, “your 2 configured workspaces”. Abstract or tiny stakes are where the literature finds nothing.
- On a streak, show the accumulated count and ship a repair alongside it: a freeze, a one-day grace, a rebuild from where the user stopped. The counter supplies the reference point; the repair stops one miss from writing the whole asset off.
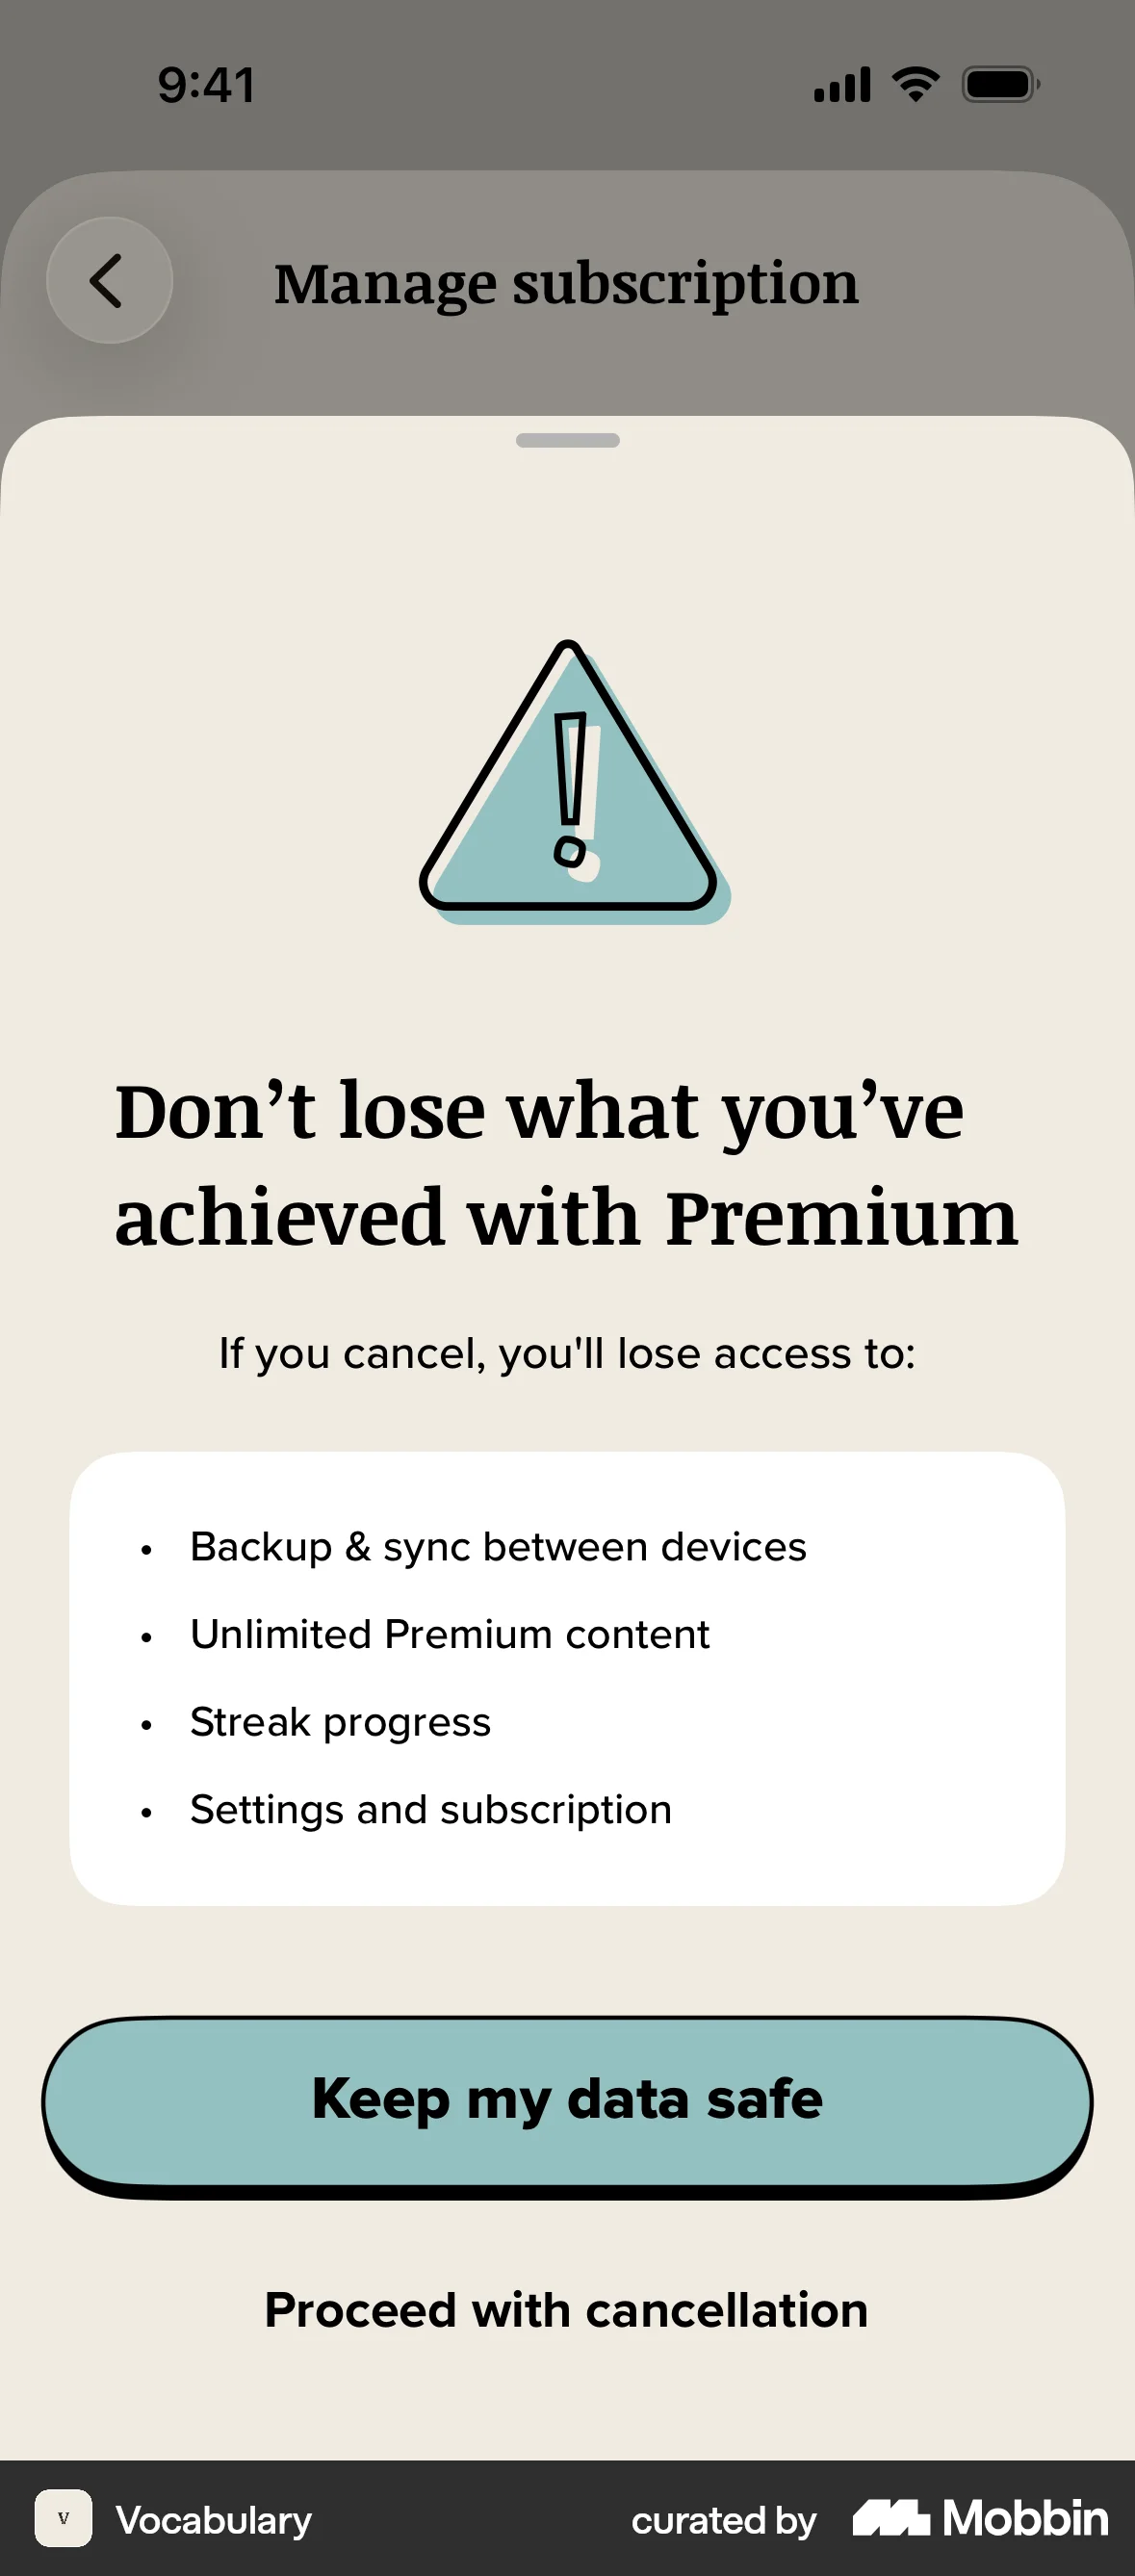
- On a trial countdown, name the capability that stops working and the date it stops, and keep the data intact past that date so the loss is reversible. This pattern is a notice, not a threat.
- In cart recovery, restore the assembled cart with its items and options instead of re-advertising the product. Reassembly cost is the stake.
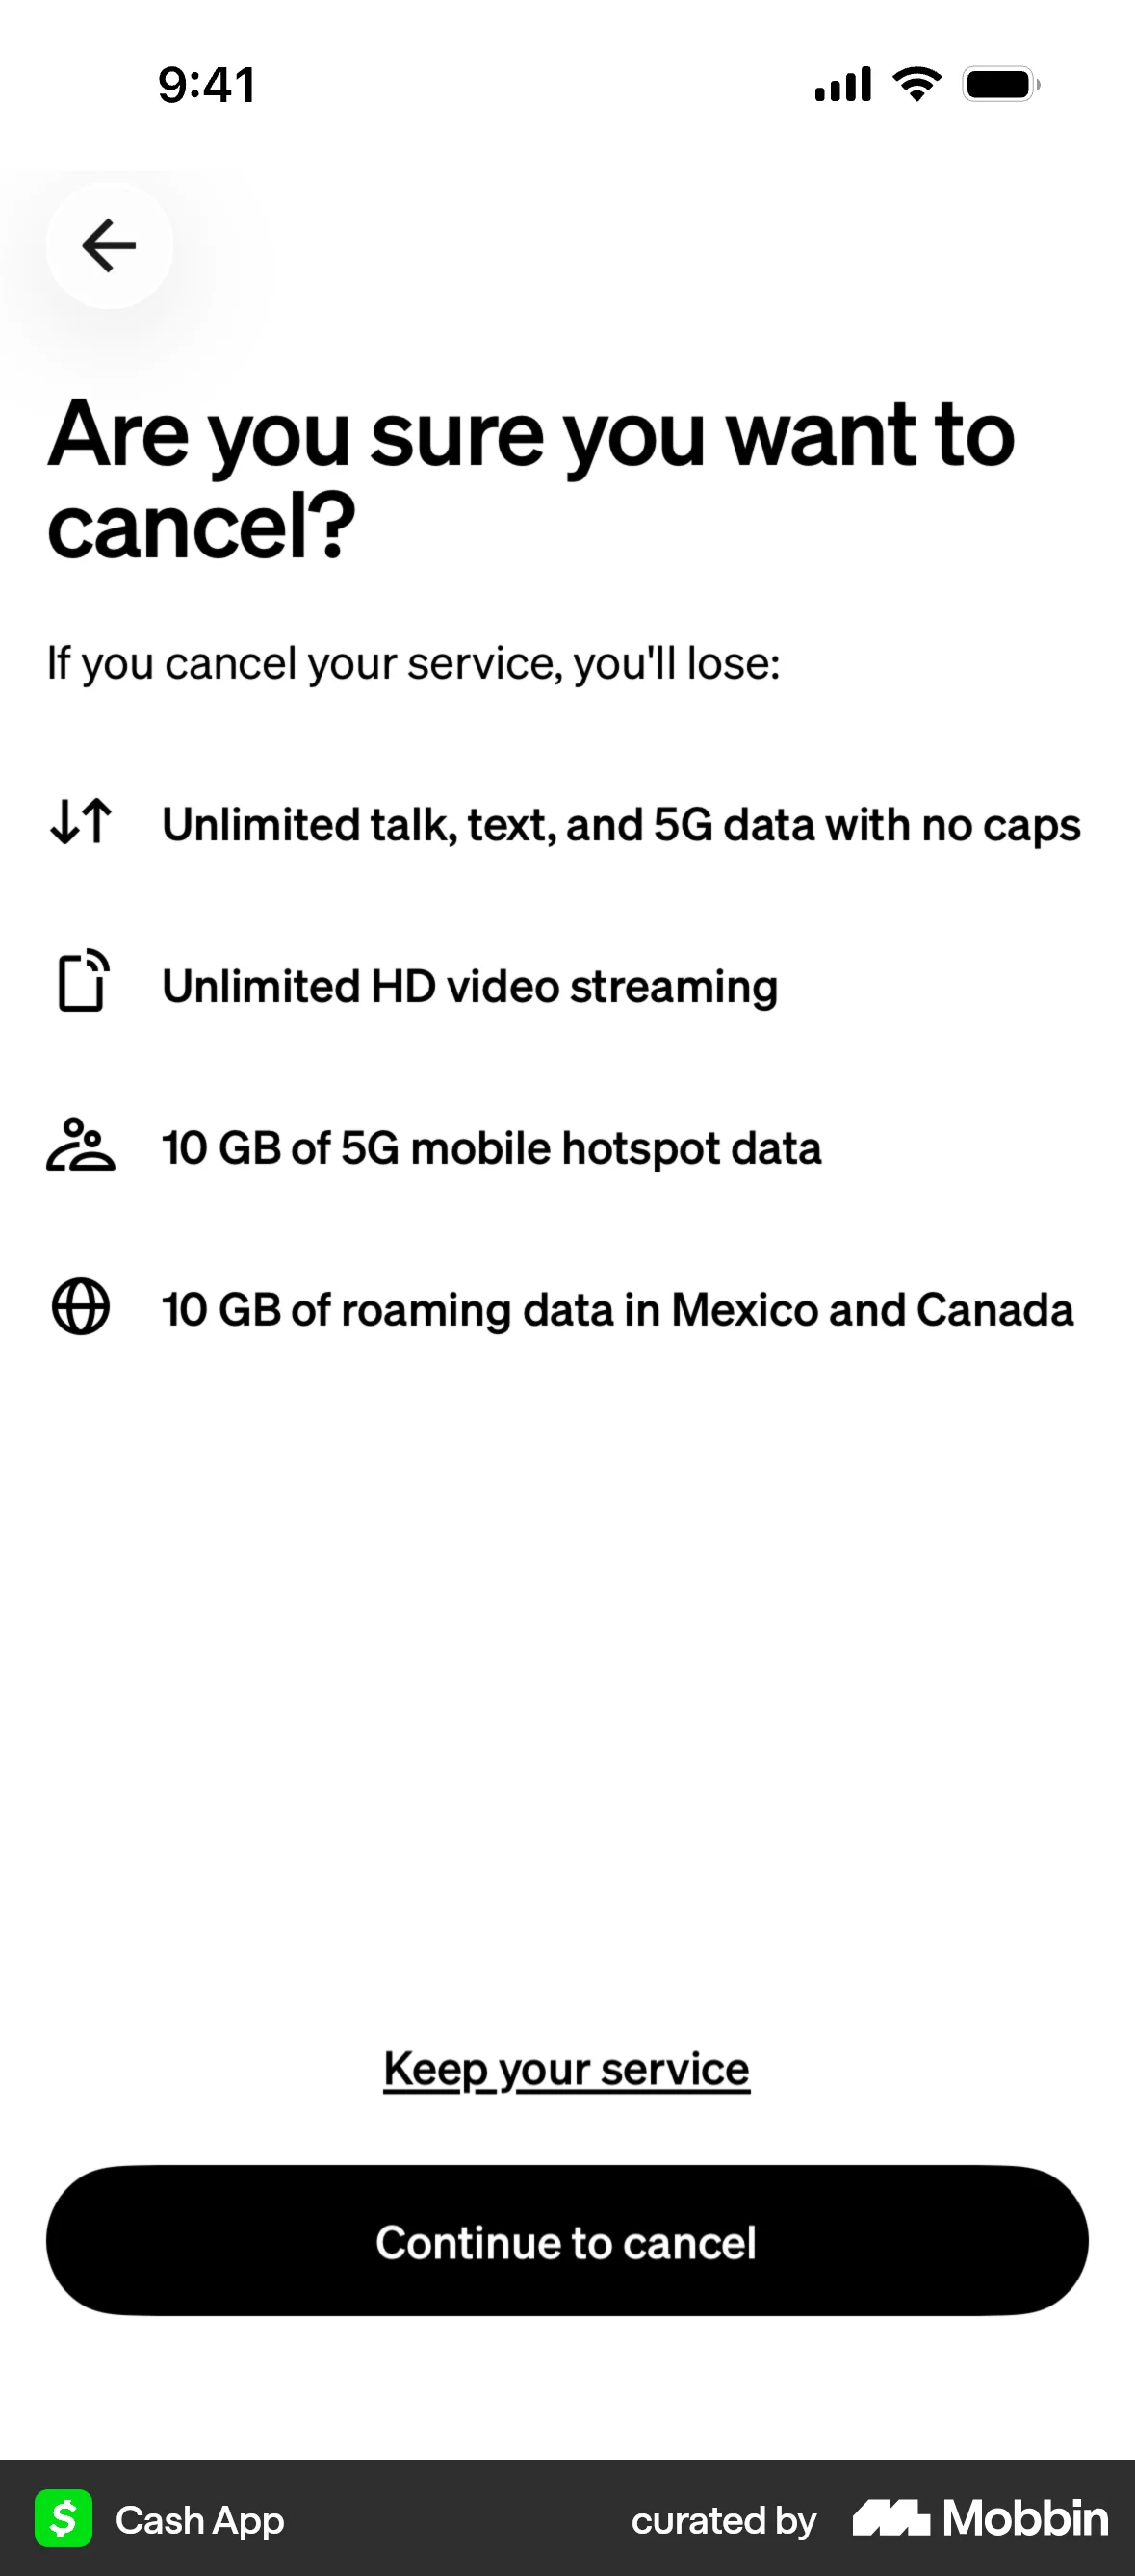
- In downgrade and cancel flows, list item by item what the account keeps and what it stops doing, and put pause next to cancel. Accuracy here is also what keeps the screen on the right side of the law.
- Where money is involved, attach the stake to something the user deposited or was allocated up front, the design that produced the only significant arm in Patel et al. Plan for the lift to decay when the stake is withdrawn.
- Ship every loss-framed screen with a gain-framed variant of equal value in the same experiment. With meta-analytic estimates between 1.31 and 1.96 depending on the task, the direction in your product is a measurement, not a prediction.
What to avoid
- Threatening to delete the user's own data to force an upgrade. Beyond the ethics, data the user provided under consent or contract and that is processed by automated means falls under GDPR Article 20: they have the right to receive it in a structured, commonly used and machine-readable format and to transmit it elsewhere without hindrance. Paywalling the export is a compliance problem dressed up as retention.
- Manufacturing the loss. Falsely stating that a product will only be available for a limited time, or only on particular terms for a limited time, in order to elicit an immediate decision and deprive consumers of sufficient opportunity or time to make an informed choice, is a banned practice in all circumstances under paragraph 7 of Schedule 20 of the UK's Digital Markets, Competition and Consumers Act 2024, and the equivalent blacklist entry exists in the EU Unfair Commercial Practices Directive. A countdown that resets on reload is this practice. In a 2023 sweep by the European Commission and national consumer authorities, manipulative online practices were found on 148 of 399 online shops screened, with fake countdown timers among the three categories checked.
- Framing the loss and then hiding the exit. For online subscriptions sold in the US, 15 U.S.C. § 8403 requires that the seller clearly and conspicuously disclose all material terms before taking billing information, obtain express informed consent before charging, and provide simple mechanisms for a consumer to stop recurring charges.
- Resetting long-held progress as a punishment for absence. Nothing in the evidence says punishment retains; the field results come from a real stake the user was given, and even those faded once the stake was removed.
- Quoting “losses loom twice as large” as a design rule. The claim survives as a pooled average over a broad literature (1.955) and does not survive the narrower test on mixed risky choices (1.31), and it is absent for small amounts.
- Leaning on loss-framed wording while changing nothing else. On the best available message-framing evidence, gain framing was if anything slightly more persuasive.
Real-world examples

Measuring it
- Completion or retention of the specific action in a randomised loss-framed arm against a gain-framed arm of equal value. A before/after comparison cannot separate the frame from the default.
- Whether the lift survives removal of the stake. In Patel et al. every incentive arm decayed to control level during the unincentivised follow-up.
- The backfires: immediate cancellations or deletions among users who saw the loss message, support contacts about data being deleted, unsubscribes from that message channel, and repeat visits to the cancellation page without cancelling.
- Reactance, tracked separately by user tenure. A pressured loss message can produce the opposite of compliance in exactly the experienced users whose loss aversion is lowest.
References
- Kahneman & Tversky (1979). Prospect Theory: An Analysis of Decision under Risk. Econometrica.
- Tversky & Kahneman (1992). Advances in Prospect Theory: Cumulative Representation of Uncertainty. Journal of Risk and Uncertainty.
- Brown, Imai, Vieider & Camerer (2024). Meta-Analysis of Empirical Estimates of Loss Aversion. Journal of Economic Literature.
- Walasek, Mullett & Stewart (2024). A Meta-Analysis of Loss Aversion in Risky Contexts. Journal of Economic Psychology.
- Gal & Rucker (2018). The Loss of Loss Aversion: Will It Loom Larger Than Its Gain? Journal of Consumer Psychology.
- Gal (2006). A Psychological Law of Inertia and the Illusion of Loss Aversion. Judgment and Decision Making.
- Mrkva, Johnson, Gächter & Herrmann (2020). Moderating Loss Aversion: Loss Aversion Has Moderators, But Reports of Its Death Are Greatly Exaggerated. Journal of Consumer Psychology.
- Zeif & Yechiam (2022). Loss Aversion (Simply) Does Not Materialize for Smaller Losses. Judgment and Decision Making.
- Yechiam (2019). Acceptable Losses: The Debatable Origins of Loss Aversion. Psychological Research.
- Yechiam & Hochman (2013). Losses as Modulators of Attention: Review and Analysis of the Unique Effects of Losses over Gains. Psychological Bulletin.
- Ert & Erev (2013). On the Descriptive Value of Loss Aversion in Decisions under Risk: Six Clarifications. Judgment and Decision Making.
- Walasek & Stewart (2019). Context-Dependent Sensitivity to Losses: Range and Skew Manipulations. Journal of Experimental Psychology: Learning, Memory, and Cognition.
- Plott & Zeiler (2005). The Willingness to Pay–Willingness to Accept Gap, the “Endowment Effect,” Subject Misconceptions, and Experimental Procedures for Eliciting Valuations. American Economic Review.
- Patel et al. (2016). Framing Financial Incentives to Increase Physical Activity Among Overweight and Obese Adults: A Randomized, Controlled Trial. Annals of Internal Medicine.
- Hossain & List (2012). The Behavioralist Visits the Factory: Increasing Productivity Using Simple Framing Manipulations. Management Science.
- Merkle (2020). Financial Loss Aversion Illusion. Review of Finance.
- O'Keefe & Jensen (2007). The Relative Persuasiveness of Gain-Framed and Loss-Framed Messages for Encouraging Disease Prevention Behaviors: A Meta-Analytic Review. Journal of Health Communication.
- Digital Markets, Competition and Consumers Act 2024, Schedule 20, paragraph 7 (UK banned practices).
- Regulation (EU) 2016/679 (GDPR), Article 20 — right to data portability.
- 15 U.S.C. § 8403 — negative option requirements for online sales.
- European Commission (2023). Consumer Protection: Manipulative Online Practices Found on 148 out of 399 Online Shops Screened. Press release IP/23/418.
- Google. Inactive Google Account Policy.
For agents
An agent-friendly guide to this principle lives at /agents/loss-aversion.md.
Our MCP server and skills for all principles are coming soon.
Similar principles
Disclaimer: The theories here are just that — theories. They may not apply universally and should be considered in context. Use your own judgment and consult additional sources when applying these principles.