Decoy effect
Also called the attraction or asymmetric dominance effect. People judge an option against the set in front of them rather than against a fixed internal scale, so an option beaten outright on every attribute hands its neighbour a free win.
0The effect began as theory-testing, not as a sales tactic. Huber, Payne and Puto (1982) built it to violate regularity — the axiom that adding an option cannot raise the chance of picking one already in the set — by adding a third option dominated by the target but not by the competitor. It raised the target's share. Their own retrospective admits the first experiments worked for some choice sets and not others, and that they gradually identified the sets that worked. The decoy's share was held to roughly 2% across those studies, which is how you know the dominance was seen: a third tier that takes more than that is not being read as dominated.
The replication record is the part the pricing-page advice leaves out. Yang and Lynn (2014) ran 91 attempts at an attraction effect across 11 experiments and 23 product classes. Eleven produced a significant shift toward the target — 12.1%, more than chance alone, and far fewer than their power analyses predicted if the effect were as large as Heath and Chatterjee's (1995) meta-analysis reported. What separated hits from misses was how the options were described: 9 of 37 numbers-only scenarios worked, against 2 of 54 that distinguished options with a picture or a meaningful word such as a brand name, and the mean share shift was 8.0% against 1.1%.
Frederick, Lee and Baskin (2014) found the same split across 38 studies. Four of their five fully numeric, matrix-style tests produced an attraction effect; of the 27 where at least one attribute had to be seen, tasted or touched, none did. Printed as numbers, winning probabilities lifted the target gamble from 14% to 28%; drawn as shaded wheels they moved nothing, and a 4,033-respondent rerun reproduced both results. A numeric picture-quality rating took the target television from 33% to 57%, while the same choice shown as photographs pushed it the other way, 53% down to 35%, and tasting dilute grape Kool-Aid beside the full-strength version cut the full-strength share from 53% to 39%. If your comparison is carried by images, a dominated neighbour is about as likely to cost the sale as win it.
The Economist subscription story is the most repeated piece of evidence and the weakest. Ariely's Predictably Irrational opens with it: add a $125 print-only option that nobody picks and share of the $125 print-and-web bundle rises from 32% to 84%. Those figures come from his own MBA class. The published version of the stimulus is Kivetz, Netzer and Srinivasan (2004), who put it to 29 students in one classroom and 30 in another and report 43% against 72%. Frederick and colleagues tried twice to reproduce it — picnickers, then 2,003 survey respondents — and found no attraction effect either time; in the larger sample a substantial fraction simply bought the print-only “decoy.” It has never been run as a field experiment, so there is no published pricing-page result to copy.
Huber, Payne and Puto (2014) defended the finding and then conceded the practical point. The effect, they hold, “remains robust because it holds when the conditions of the study are essentially replicated,” and was never offered as a tool for marketing practice. They now “suspect that the asymmetric dominance effect occurs rarely in the marketplace today, at least in its strict regularity-violating form”: real products carry messy attributes, so almost nothing is unambiguously dominated, and dominated products do not survive because nobody buys them. What they say merchants succeed with is the compromise effect — flanking a target with a dearer and a cheaper option. Their sharpest evidence against themselves comes from a commercial conjoint data set: across nearly 4,000 asymmetrically dominated sets the dominating option gained no share, respondents having settled into a rule and deciding in about 12 seconds. Their nearest field evidence is a 1999 supermarket study by Doyle and colleagues, where identical cans of Heinz baked beans priced slightly higher raised the cheaper target's share in real purchases — one display, in one shop.
Recent well-powered work with money on the line finds the effect, and finds it small and two-sided. Dumbalska, Li, Tsetsos and Summerfield (2020) paid participants to pick the best-value rental from three photographs, each with a price and a star rating calibrated to that participant's own valuations. Attraction and compromise decoys were both significant, and so was a “repulsion” decoy that dominates the other target; all three moved preference by about 3 to 5 percentage points, with the attraction and repulsion halves roughly symmetric. Across four preregistered perceptual studies, Spektor, Kellen and Hotaling (2018) “generally observed large repulsion effects, with an attraction effect being observed only under a very specific set of circumstances,” with the display format deciding the sign.
The underlying claim — that people value an option against the set in front of them rather than against a fixed internal scale — is about as well supported as anything in the field. The tactic built on it is not: it works mostly where every attribute is a number, and the people who discovered it think it is rare in real markets. Make the comparison legible and point it at the plan you want chosen, rather than betting a launch on a dominated tier.
When it holds
- Every attribute is a number the user can compare in place. Frederick and colleagues found attraction effects in four of five fully numeric tests and in none of 27 where an attribute had to be experienced; Yang and Lynn measured an 8.0% mean share shift with numbers-only options against 1.1% with a picture or a meaningful label.
- The dominance is visible at a glance and the decoy is genuinely unwanted. Its share was about 2% in the original studies, while in the failed replications participants chose the decoy as often as 18% — which Huber and colleagues read as the dominance never being perceived, and they cite evidence that the effect vanishes when there is no time to read the options.
- The two real options are close to a coin flip beforehand. Huber and colleagues name strong prior trade-offs as the main suppressor, and report no detectable effect across nearly 4,000 dominated sets in practised conjoint choices; merely rating attribute importance first diminishes it.
- Preferences are weak or unformed rather than divided. The effect is an aggregate one, so a population split between people who want the cheap thing and people who want the good thing cancels it out.
- It points upmarket more reliably than down. Heath and Chatterjee's meta-analysis found regularity violated only when higher-quality brands were the target: decoys typically raise a higher-quality option's share without raising a lower-quality one's.
- It reverses. With tasted, photographed or branded options the same manipulation produced repulsion as often as attraction in Frederick and colleagues' set, and a decoy that dominates the other option shifts choices away from it by about as much as a dominated decoy shifts them toward it.
- Not when the attributes are framed as losses. Huber and colleagues report the effect is strongly limited in a negative domain, where an unattractive decoy pushes attention to the competitor instead.
How to apply
- Give every tier the same attributes, in the same order, as numbers, before you add anything. A dominated option does no work if the dominance cannot be read off the table.
- Put the third tier immediately beside the one it is meant to flatter, in the same row order, so the two are compared without scrolling. Formatting that separates them is enough to remove the effect.
- Point the comparison at the premium tier rather than the cheap one, which is the only direction the meta-analytic evidence supports.
- Price the third tier so it loses on every line, not on one. A tier that is worse on price but better on one feature is a real competitor and will take share from your target.
- On any page where plans are sold with photographs, logos or prose, flank the tier you recommend with a dearer and a cheaper one instead of a dominated one. That compromise layout is the pattern the original authors say they actually see work in markets.
- Where the choice is carried by images or taste, spend the effort on a recommended badge, a feature-by-feature table and a preselected default; the decoy is the manipulation that stops working there.
What to avoid
- Listing a tier you do not intend to sell. The FTC's Guides Against Bait Advertising define bait advertising as “an alluring but insincere offer to sell a product or service which the advertiser in truth does not intend or want to sell,” and 16 CFR 238.1 states that no offer should be published “when the offer is not a bona fide effort to sell the advertised product.”
- Showing a price you cannot honour. Annex I of the EU Unfair Commercial Practices Directive makes it unfair in all circumstances to invite purchase at a specified price without disclosing reasonable grounds for believing you cannot supply at that price (point 5), and to invite purchase and then refuse to show, order or deliver the item in order to promote a different one (point 6, bait and switch).
- Making the decoy a phantom — shown, then declared sold out or unavailable at checkout. That is the blacklisted practice above, not a pricing experiment.
- Building the decoy out of invented numbers: a reference price nobody paid, a seat count nobody filled, a review score nobody gave.
- Obscuring what differs between tiers. The effect requires that the dominance be obvious, so an unreadable table suppresses it and damages trust at the same time.
- Betting a launch or a quarter on it. The best-measured hit rate is about one attempt in eight, the shift when it lands is a few percentage points, and with visual or branded options a dominated neighbour taints the option it resembles about as often as it flatters it.
Real-world examples


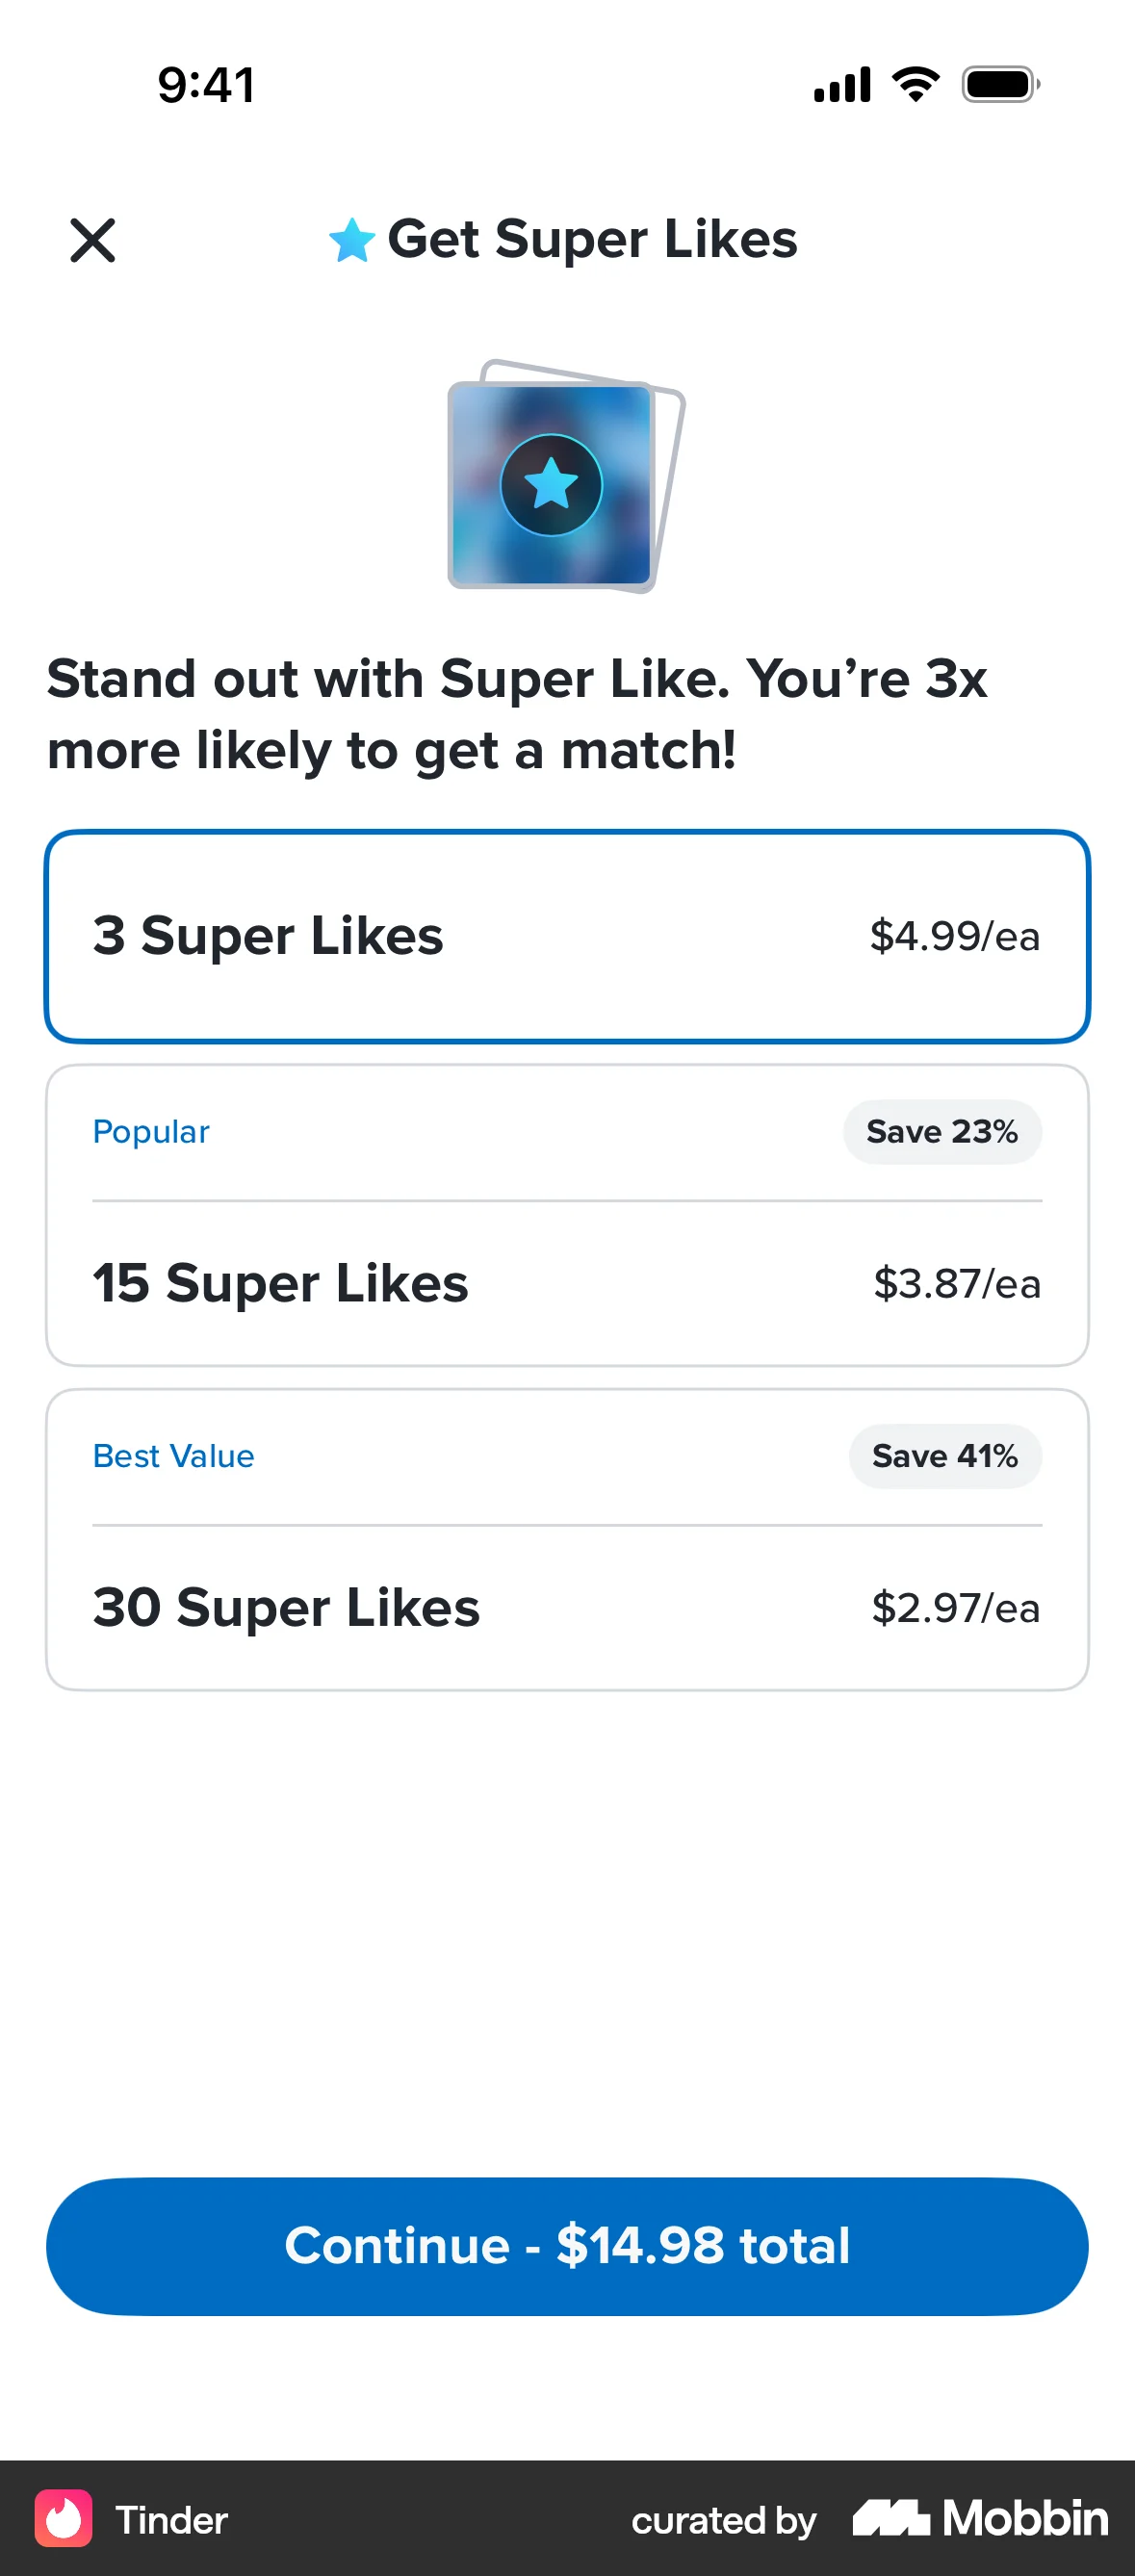

Measuring it
- Primary metric: the target's share of the two real options — target divided by target plus competitor — against a two-option control cell. The literature computes it this way, ignoring the decoy's share, so matching that convention keeps your number comparable to the published ones.
- Power the test for a few percentage points, not for a headline. Yang and Lynn's scenarios were sized for an 11.4-point shift and still produced significant effects in 12% of attempts; a page with a 70/30 split between tiers needs a lot of traffic to see anything at all.
- Secondary: revenue or margin per visitor. A share shift toward a dearer tier that arrives with lower overall conversion is a loss dressed as a win.
- Backfire metrics: the competitor tier's share rising instead of the target's — the repulsion result, which in non-numeric settings has shown up as often as the effect you wanted — and the decoy's own take rate. If the decoy climbs past a few percent the test is invalid and you owe those buyers a real product, with real support and real fulfilment.
- Backfire metric: downgrades, refunds and cancellations inside the first billing period, plus support contacts asking what the difference between tiers actually is. A decoy that moved share by confusing people shows up here rather than in the conversion number.
References
- Huber, Payne & Puto (1982). Adding Asymmetrically Dominated Alternatives: Violations of Regularity and the Similarity Hypothesis. Journal of Consumer Research.
- Heath & Chatterjee (1995). Asymmetric Decoy Effects on Lower-Quality Versus Higher-Quality Brands: Meta-Analytic and Experimental Evidence. Journal of Consumer Research.
- Kivetz, Netzer & Srinivasan (2004). Alternative Models for Capturing the Compromise Effect. Journal of Marketing Research.
- Frederick, Lee & Baskin (2014). The Limits of Attraction. Journal of Marketing Research.
- Yang & Lynn (2014). More Evidence Challenging the Robustness and Usefulness of the Attraction Effect. Journal of Marketing Research.
- Huber, Payne & Puto (2014). Let's Be Honest About the Attraction Effect. Journal of Marketing Research.
- Spektor, Kellen & Hotaling (2018). When the Good Looks Bad: An Experimental Exploration of the Repulsion Effect. Psychological Science.
- Dumbalska, Li, Tsetsos & Summerfield (2020). A map of decoy influence in human multialternative choice. Proceedings of the National Academy of Sciences.
- FTC (1967, as amended). Guides Against Bait Advertising, 16 CFR Part 238, sections 238.0, 238.1 and 238.3.
- European Parliament & Council (2005). Directive 2005/29/EC on unfair business-to-consumer commercial practices, Annex I points 5 and 6.
For agents
An agent-friendly guide to this principle lives at /agents/decoy-effect.md.
Our MCP server and skills for all principles are coming soon.
Similar principles
Disclaimer: The theories here are just that — theories. They may not apply universally and should be considered in context. Use your own judgment and consult additional sources when applying these principles.