Partitioned pricing
Showing a price as a base plus mandatory surcharges rather than one all-inclusive figure. People anchor on the first number and underweight or skip the rest, so the decision is made against a total they never computed.
Morwitz, Greenleaf and Johnson (1998) named the practice and gave it its mechanism: splitting a price into a base and a mandatory surcharge lowers the total people recall, because the base reads as the price and the surcharge as a detail. Across their studies, as the authors' own later review reports, between 12.2% and 35.6% of participants left the surcharge out entirely when asked what the item cost, and stating it as a percentage of the base rather than in currency pushed recalled totals lower still. The interface decision is not whether to itemise but which number sits in the slot people read as the price.
The pooled record does not support the simple version of the claim. Abraham and Hamilton (2018) meta-analysed 149 observations from 27 papers, N = 12,878, and put the mean effect of partitioning on demand at d = 0.08, p > .10 — indistinguishable from zero — with I² = 83.72%: significant positive and negative effects both sit in this literature and cancel. The moderators set the sign. In the full coefficient table, reported in Abraham's (2015) dissertation version of the analysis, showing the total made partitioning less favourable, a gap of 0.32 d between total-absent and total-present; a surcharge seen as delivering high benefit made it more favourable by 0.56 d, and one that is typically partitioned in the category by 0.58 d. Absolute and relative surcharge magnitude were both null as main effects, and the effect shrinks year on year. Partitioning has no direction of its own; the total's visibility and the surcharge's plausibility do.
The large field numbers people quote for partitioned pricing are really about total salience. Chetty, Looney and Kroft (2009) added a second, tax-inclusive price tag to roughly 750 products at a supermarket where shelf prices excluded a 7.375% sales tax. Quantity sold and revenue in the treated group fell about 8% against both control groups, so against a category price elasticity of 1 to 1.5, simply showing the total cost about what a 7.375% price rise would have: most shoppers had not been counting the tax. They knew it was there — the median surveyed shopper correctly reported the tax status of 7 of the 8 products asked about — they just did not add it until a tag did it for them.
Blake, Moshary, Sweeney and Tadelis (2021) ran the same comparison on StubHub, randomly assigning half of US users to see mandatory fees only at checkout and half to see fee-inclusive prices from the first inventory screen. The back-end-fee group spent 20.64% more over ten days and was 14.1% more likely to buy at all. The intensive margin is the interesting half: conditional on buying, those users paid 5.42% more per transaction and 5.73% more per seat, so at least 28% of the revenue gain came from trading up. StubHub's buyer fee runs about 15% of the ticket price, so every listing looked 15% cheaper while people were still choosing. The funnel shows the cost — back-end users were about 19% more likely to select a ticket but about 45% less likely to complete at checkout, where the fee finally appeared — and experience did not erase it: users with ten or more prior visits still showed a 15% revenue effect against 21% overall.
The same obscured total produces choices people regret. Santana, Dallas and Morwitz (2020) dripped optional surcharges across six studies. In the first, 54.5% of participants initially picked the lower-base-fare airline against 11.7% when fees were shown upfront, and 24.5% against 7.8% ended up paying more than the alternative would have cost. Satisfaction with the final choice was lower under dripping (M = 5.39 against 5.83), and the choice itself carried it: people who ended on the lower-base option rated it 4.60 against 5.92 for those on the higher-base one. The fix was not the total on its own but a comparison — showing the competing airline's price alongside the total at the confirm step cut the mistake rate from 15.2% to 6.9%, and from 39.4% to 16.0% among those who had taken the cheaper-looking fare.
The effect has a ceiling, and the ceiling is where the surcharge stops being ignorable. In Hossain and Morgan's (2006) matched-pair eBay auctions, a 1¢ opening bid with $3.99 shipping beat a $4 opening bid with free shipping by about 21% for CDs, but the gain vanished where the reserve was 53% of retail instead of under 27%. Component count has the same ceiling: the field review by Greenleaf, Johnson, Morwitz and Shalev (2016) reports participants landing within 5% of the real total 49% of the time with two price components against 23.3% with nine, an inverse-U in purchase intention where one surcharge beat two, and surcharges exceeding the base price being judged unfair, with fairness fully mediating the effect of surcharge size on purchase intention.
So grade this mixed, and keep the two halves apart. That hiding the total raises short-run revenue is about as well established as a pricing finding gets: two large field experiments in different categories, a mechanism confirmed by survey and click-stream, and consistent lab replication. That splitting a price helps you is not established at all — the pooled estimate is 0.08 and falling, and the sign flips with the total's presence and the surcharge's plausibility. The revenue half is also largely no longer yours to take: showing the all-in total up front is a legal requirement, not a preference, in the UK (section 230 of the Digital Markets, Competition and Consumers Act 2024), the US for live-event tickets and short-term lodging (16 CFR Part 464) and the EU (Directive 2005/29/EC and Directive 2011/83/EU). The lab work behind those rules is blunt about the damage: Huck, Schmid and Wallace (2013) found drip pricing wiped out 25% of consumer surplus while leaving the decision problem unchanged, and Rasch, Thöne and Wenzel (2020) found sellers competing only on base prices and setting the highest drip they could get away with. Treat an obscured total as a revenue number you are no longer allowed to earn.
When it holds
- The total's absence is the active ingredient: partitioning was less favourable when a total price was shown, a 0.32 d gap at p = .097. If your screen already carries an honest total, expect splitting to add nothing.
- The surcharge has to look like it buys something. High-benefit surcharges beat low-benefit ones by 0.56 d and category-typical ones beat atypical by 0.58 d — the two largest and most robust moderators in the meta-analysis.
- It reverses once the surcharge is large relative to the item. Hossain & Morgan (2006) saw the gain where the reserve was under 27% of retail and nothing at all where it was 53%.
- It reverses with the number of components. Comprehension fell from 49% of participants within 5% of the real total at two components to 23.3% at nine, and purchase intention followed an inverse-U, with one surcharge beating two.
- Higher-priced purchases show more of it (β = 0.0004 per unit of price level, p = .09), but this was the weakest moderator tested and held in only two of eight robustness checks.
- Experience barely helps. StubHub users with ten or more prior visits still showed a 15% revenue effect against 21% for new users, so familiarity with a fee does not make people price it in.
- The effect is decaying. Year of study was a significant negative predictor (β = −0.05, p = .01), so a benchmark taken from a 1998 or 2004 study overstates what you would measure now.
- A unilateral advantage is not a market-wide one. The 21% StubHub figure comes from being the shrouded arm on a site where half the users saw all-in prices; the companion 2012 experiment, which put whole events on one regime or the other, found users 13% less likely to buy under upfront fees at p = 0.076.
How to apply
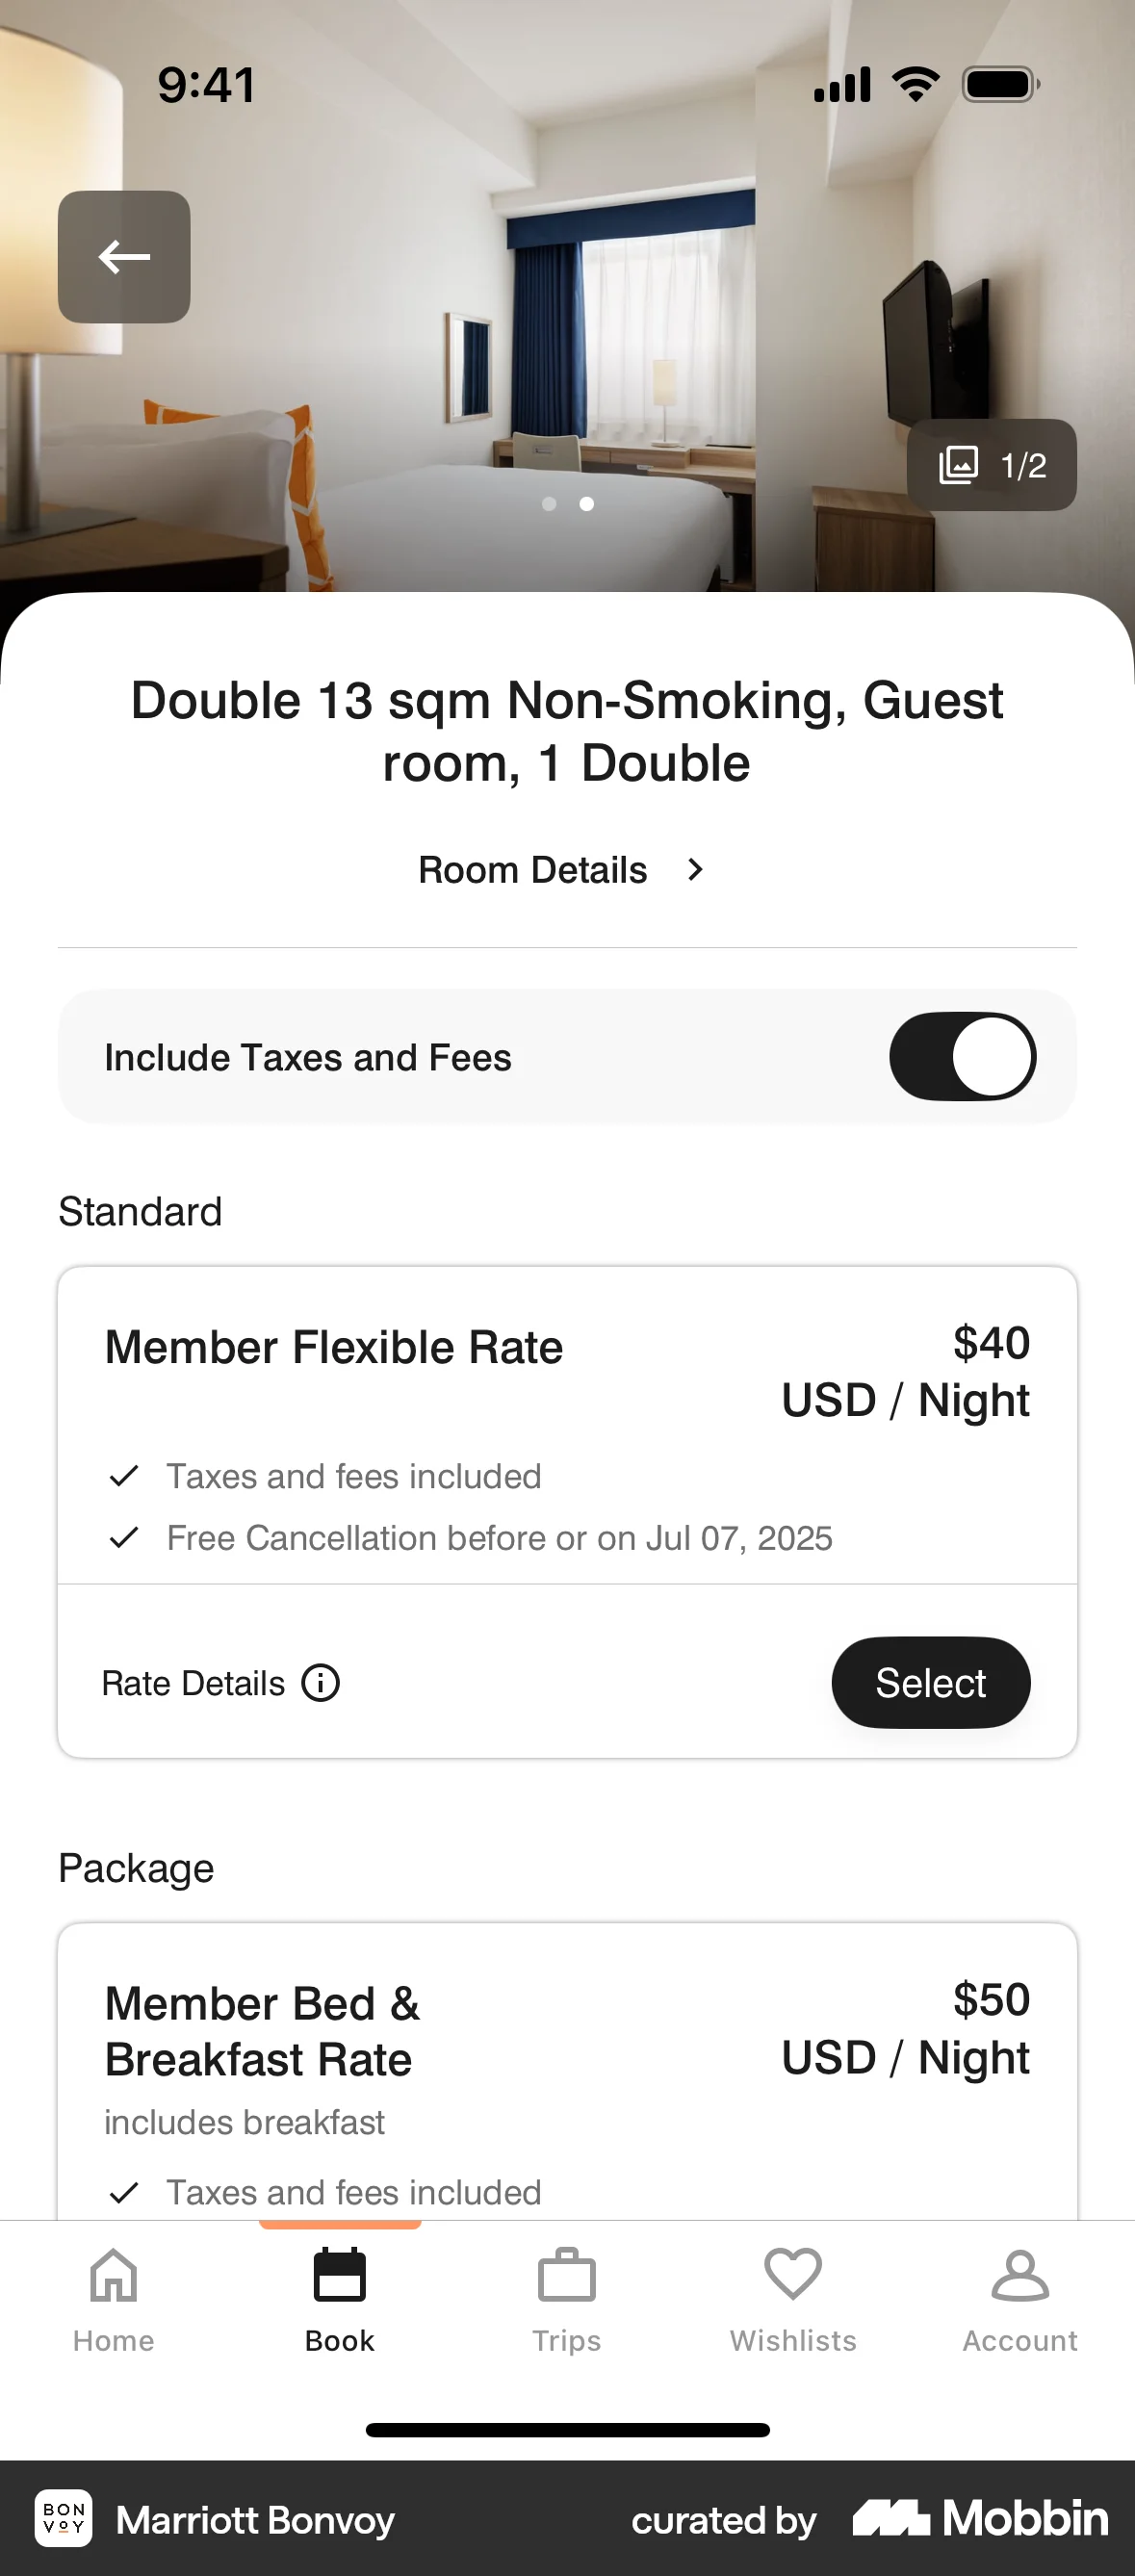
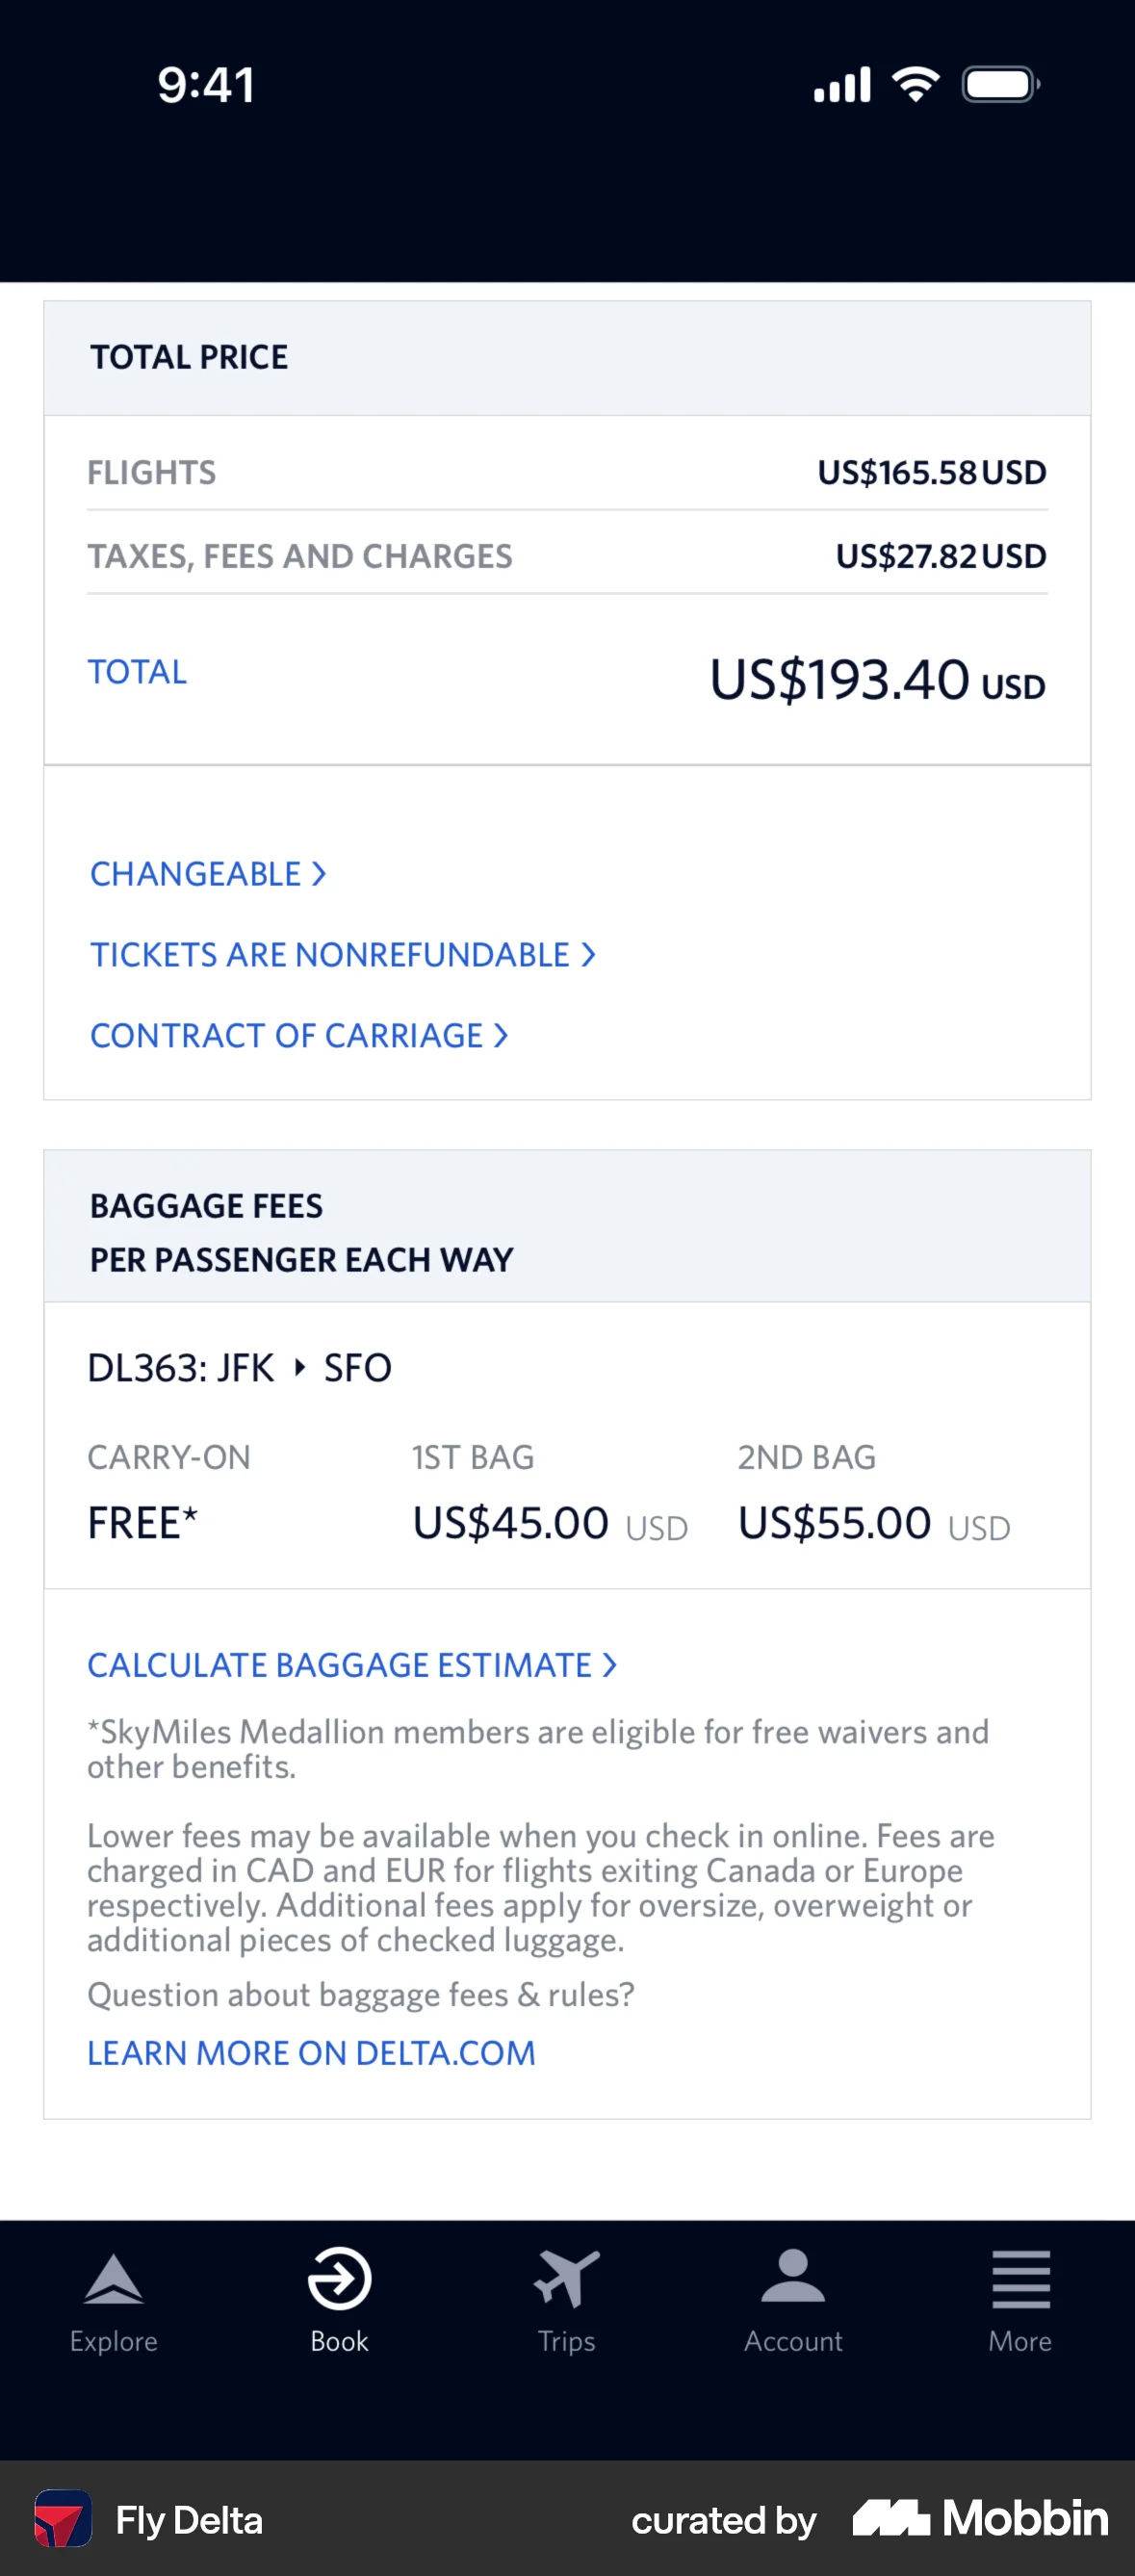
- Put the all-in total in the slot people read as the price — listing card, search result, plan tile — with the breakdown under it, and fold every unavoidable fee into that number. 16 CFR § 464.2(b) requires the total to be more prominent than any other pricing information for live-event tickets and short-term lodging, and section 230(4) of the DMCCA 2024 defines the total price as including any fee, tax or charge the consumer will necessarily incur.
- Show the tax-inclusive total on any screen that invites an EU purchase. Article 7(4) of Directive 2005/29/EC makes the price inclusive of taxes and delivery charges material information in an invitation to purchase, and Article 6(1)(e) of Directive 2011/83/EU requires the total inclusive of taxes before a distance contract is concluded.
- Keep the itemisation, drop the surprise: one line per fee, naming what it is for. 16 CFR § 464.3 makes misrepresenting the nature, purpose, amount or refundability of a fee an unfair and deceptive practice.
- Group related charges into one named line rather than listing every cost centre. Two components let 49% of people compute the total within 5%; nine dropped that to 23.3%.
- Only break out a component people can see a benefit in, and label the benefit rather than the function. A high-benefit surcharge was worth 0.56 d over a low-benefit one.
- State surcharges in currency, not as a percentage of the base. Percentage surcharges produced lower recalled totals and were skipped by more people.
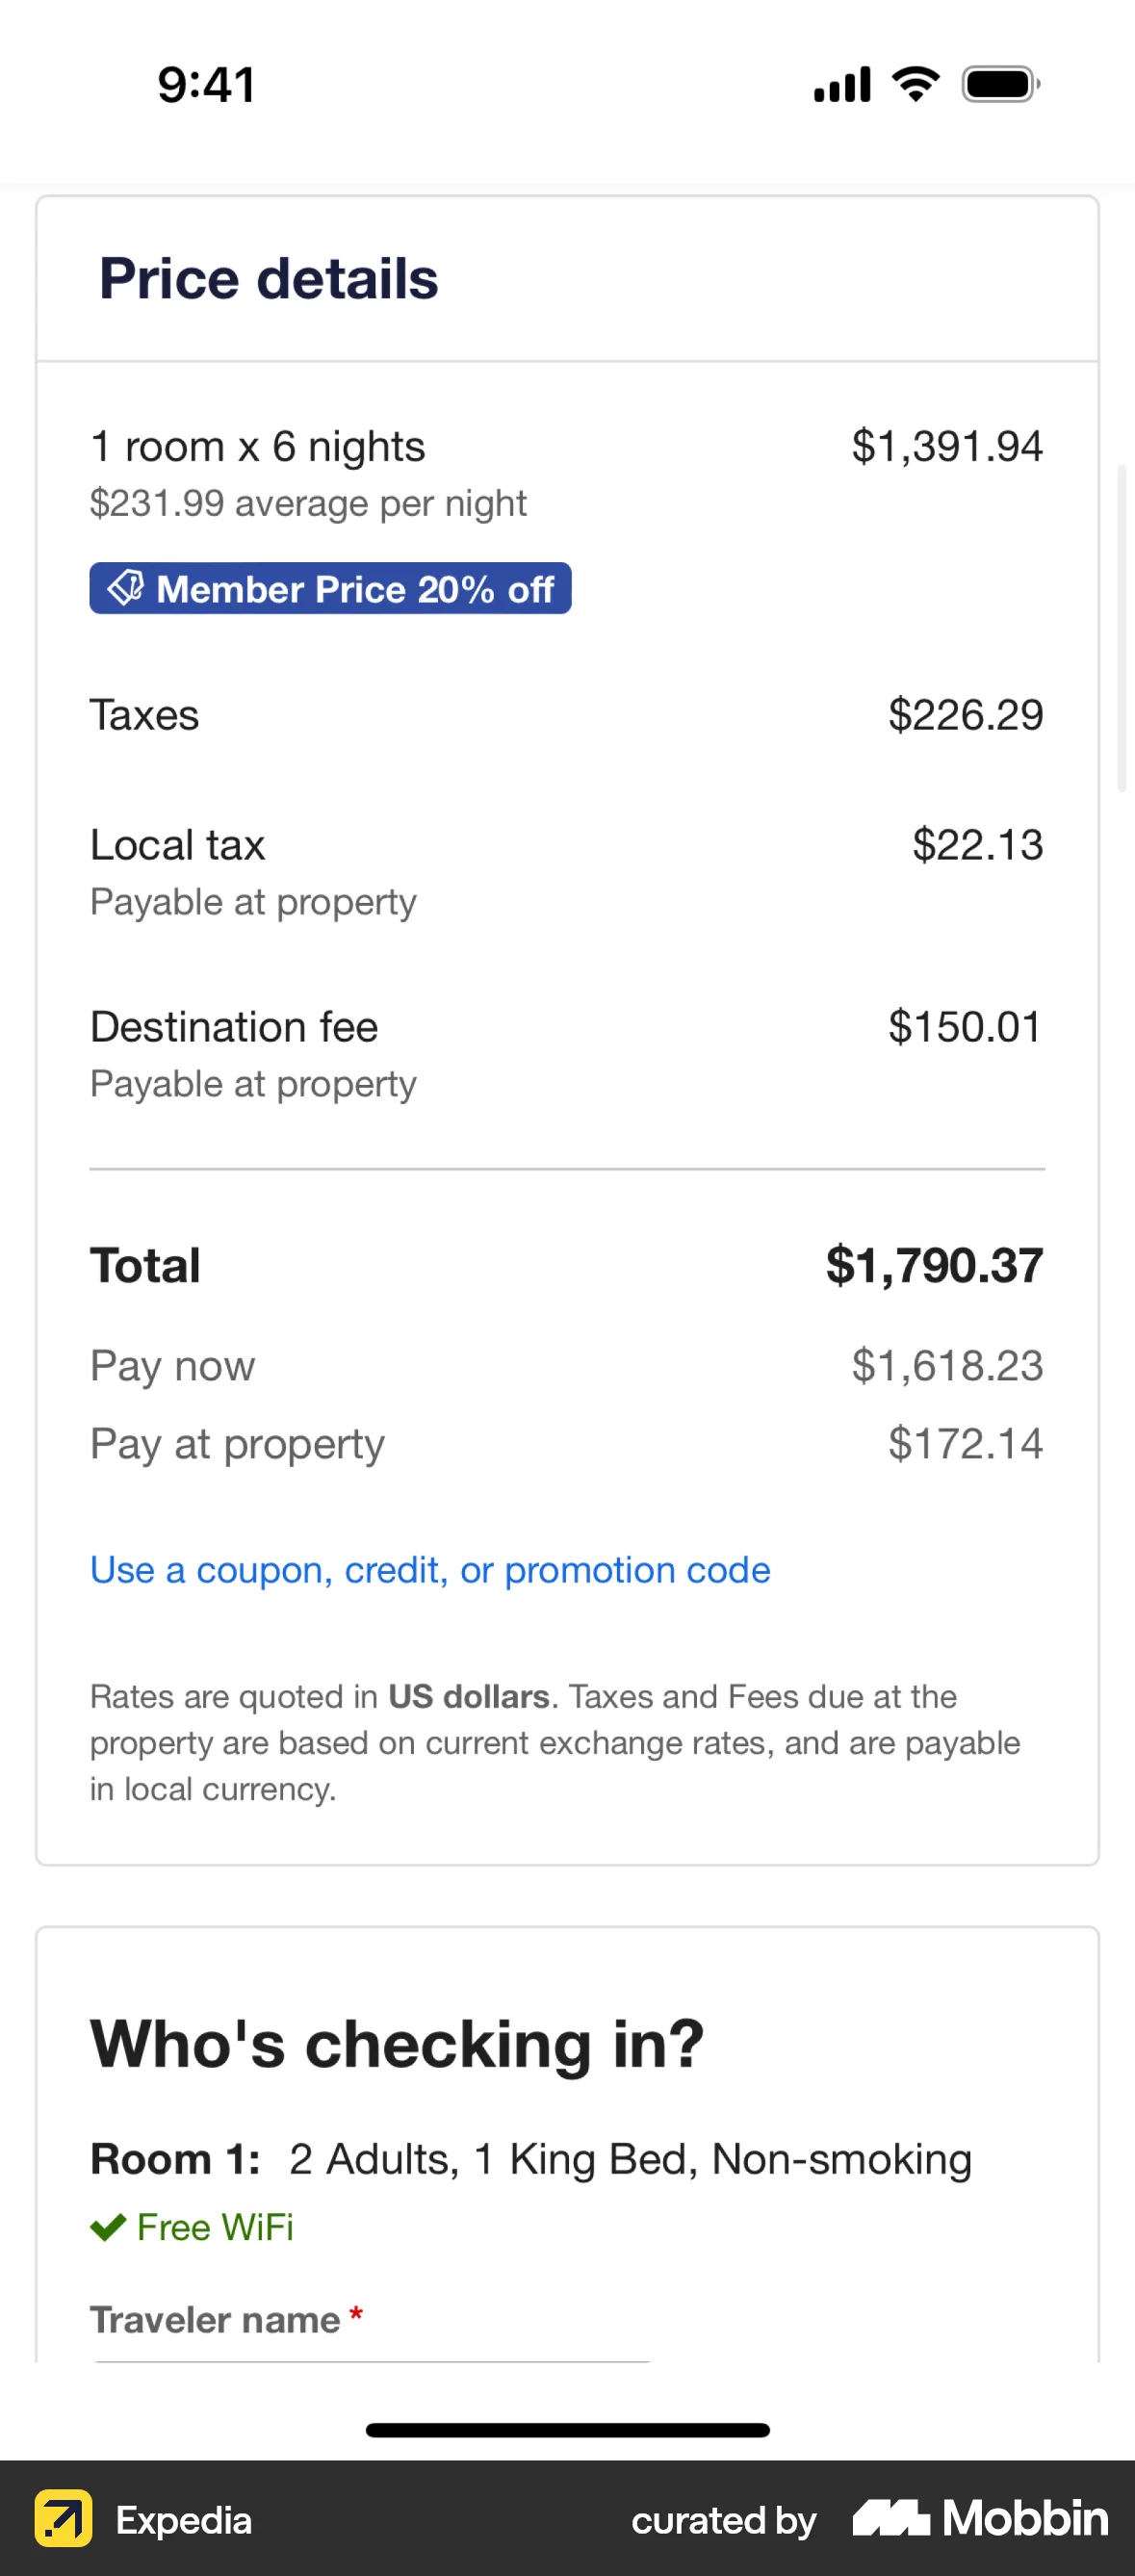
- Where a mandatory charge genuinely cannot be computed upfront, such as a city tax that depends on the stay, show the calculation method at the same prominence as the total — enough for the consumer to work the total out, as DMCCA 2024 section 230(5) requires.
- At the confirm step, show the total for the alternative the user rejected next to the one they picked. That cut the rate of ending up on the costlier option from 15.2% to 6.9%, and from 39.4% to 16.0% among those who had taken the cheaper-looking option.
What to avoid
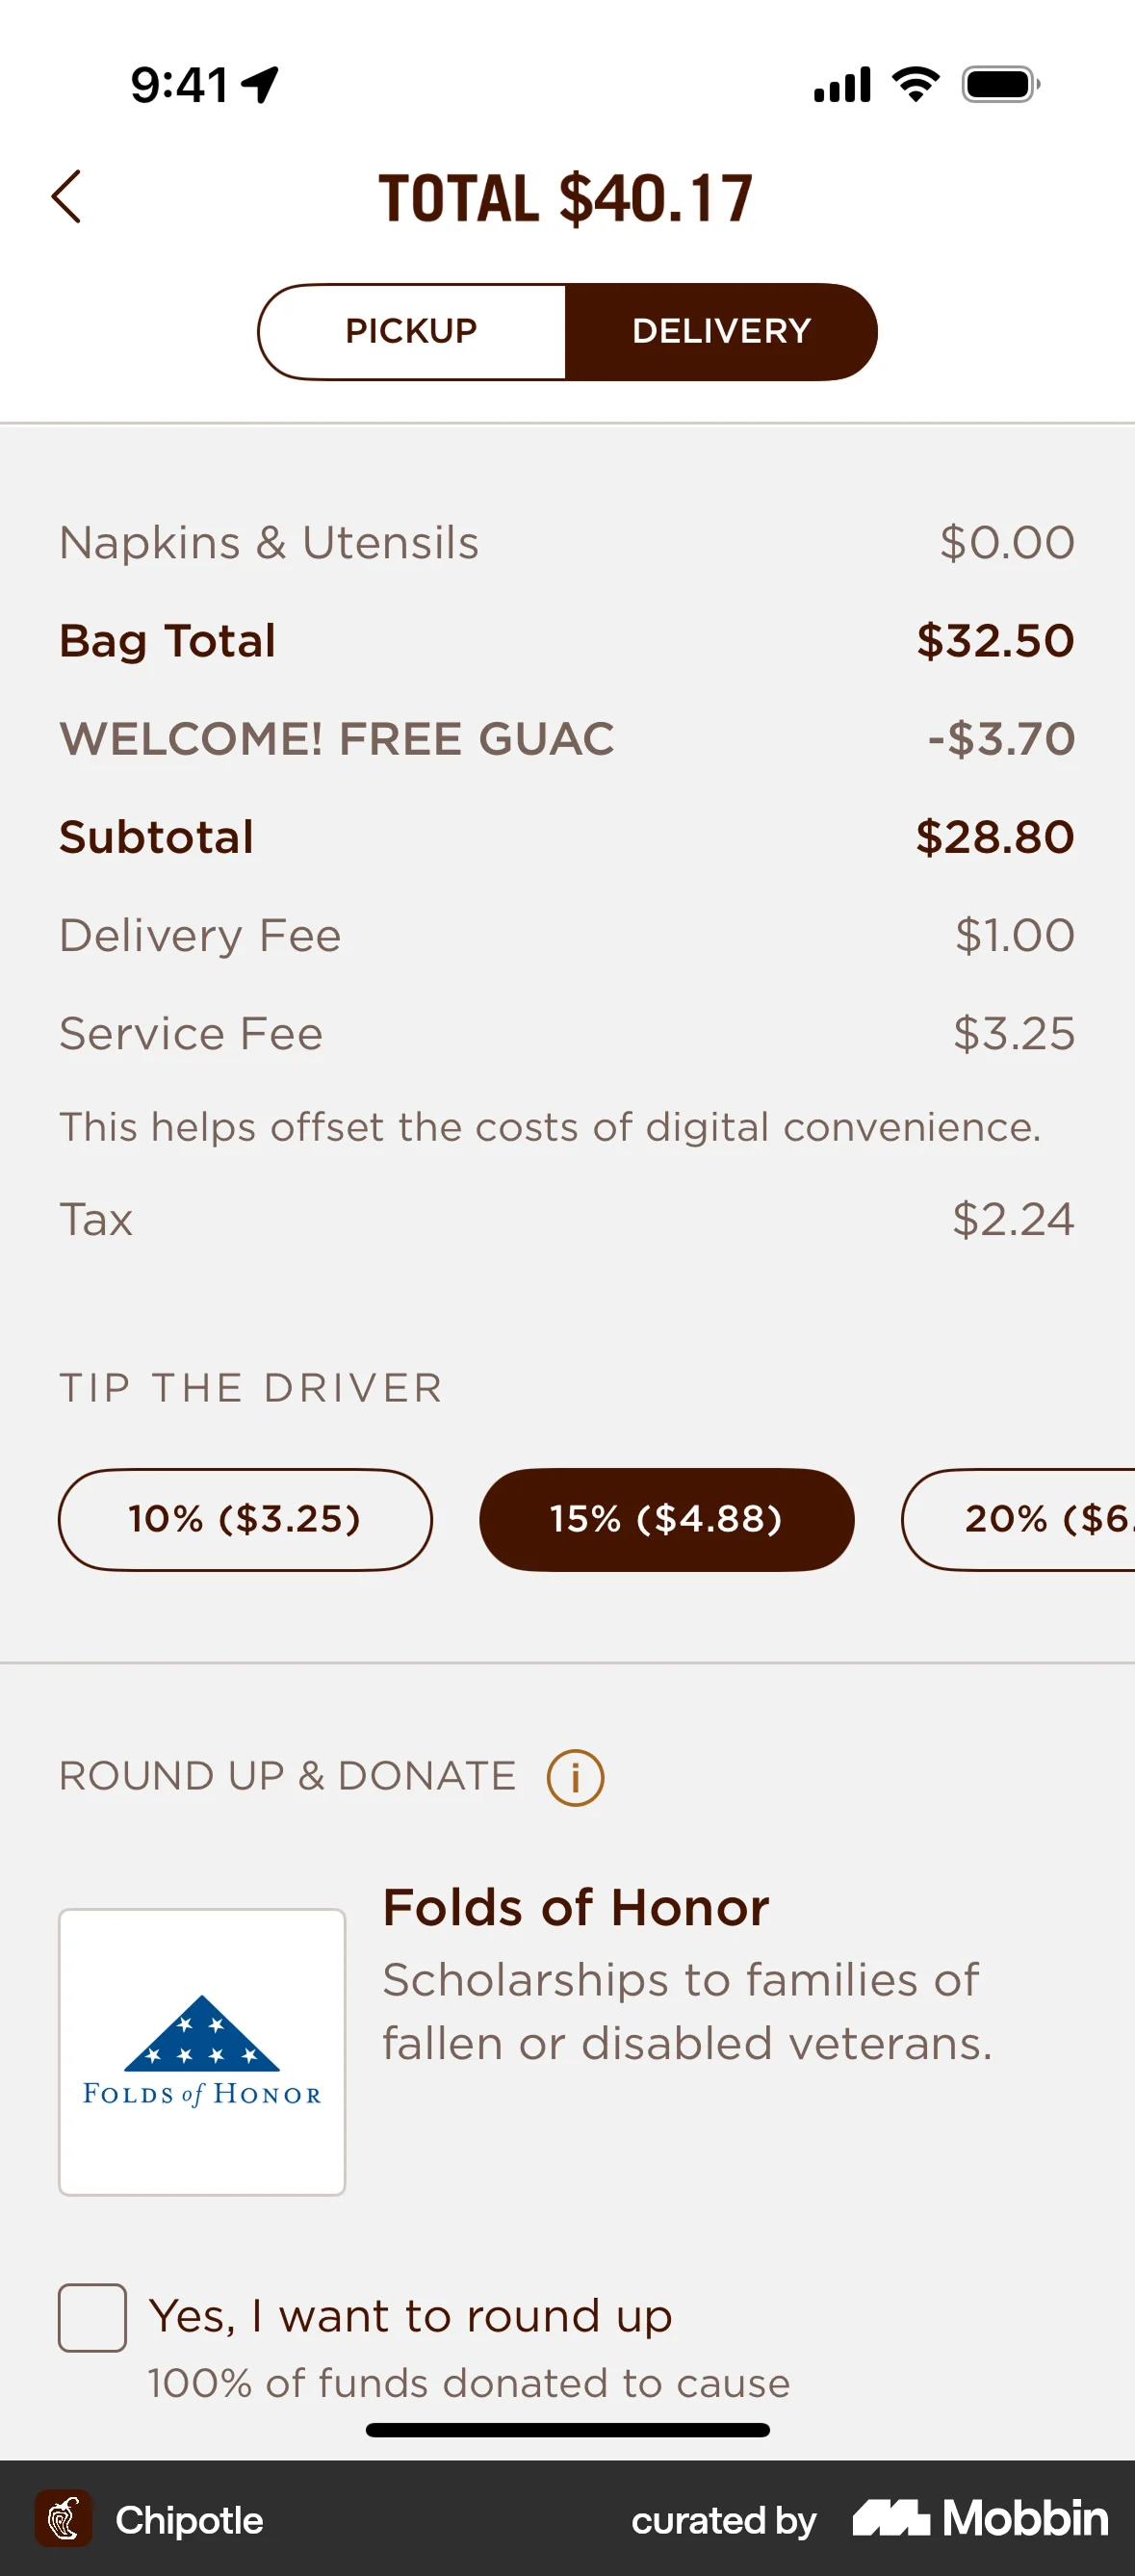
- Revealing a mandatory fee for the first time at checkout. In the UK this is a material omission from an invitation to purchase under DMCCA 2024 section 230; in the US it is an unfair and deceptive practice for live-event tickets and short-term lodging under 16 CFR § 464.2(a).
- Letting the base price outweigh the total visually — a large base with the total in small grey type below. Under 16 CFR § 464.2(b) the total has to be the more prominent of the two.
- Vague fee labels: service fee, processing, convenience. They fail the nature-and-purpose requirement of 16 CFR § 464.3, and an unexplained surcharge is the one the meta-analysis scores as low-benefit and therefore negative.
- Quoting partitioning as a reliable uplift. The pooled estimate across 149 observations is d = 0.08, p > .10, with I² = 83.72% and a significant decline year on year; half the published effects point the other way.
- Budgeting the 21% StubHub gain. That is a within-site contrast against users who saw all-in prices, the market-wide version of the experiment was 13% at p = 0.076, and in the US for tickets and lodging it is now unlawful to collect it that way.
- Letting a lower base price carry the choice and planning to recover trust later. Dripping left 24.5% of participants on an option that cost more than the alternative against 7.8% upfront, and those who ended there rated the purchase 4.60 against 5.92.
- Stacking small surcharges to keep the headline low. Both the component-count and the magnitude limits bite here, and the same behaviour is what section 230 and 16 CFR Part 464 were written to stop.
Real-world examples
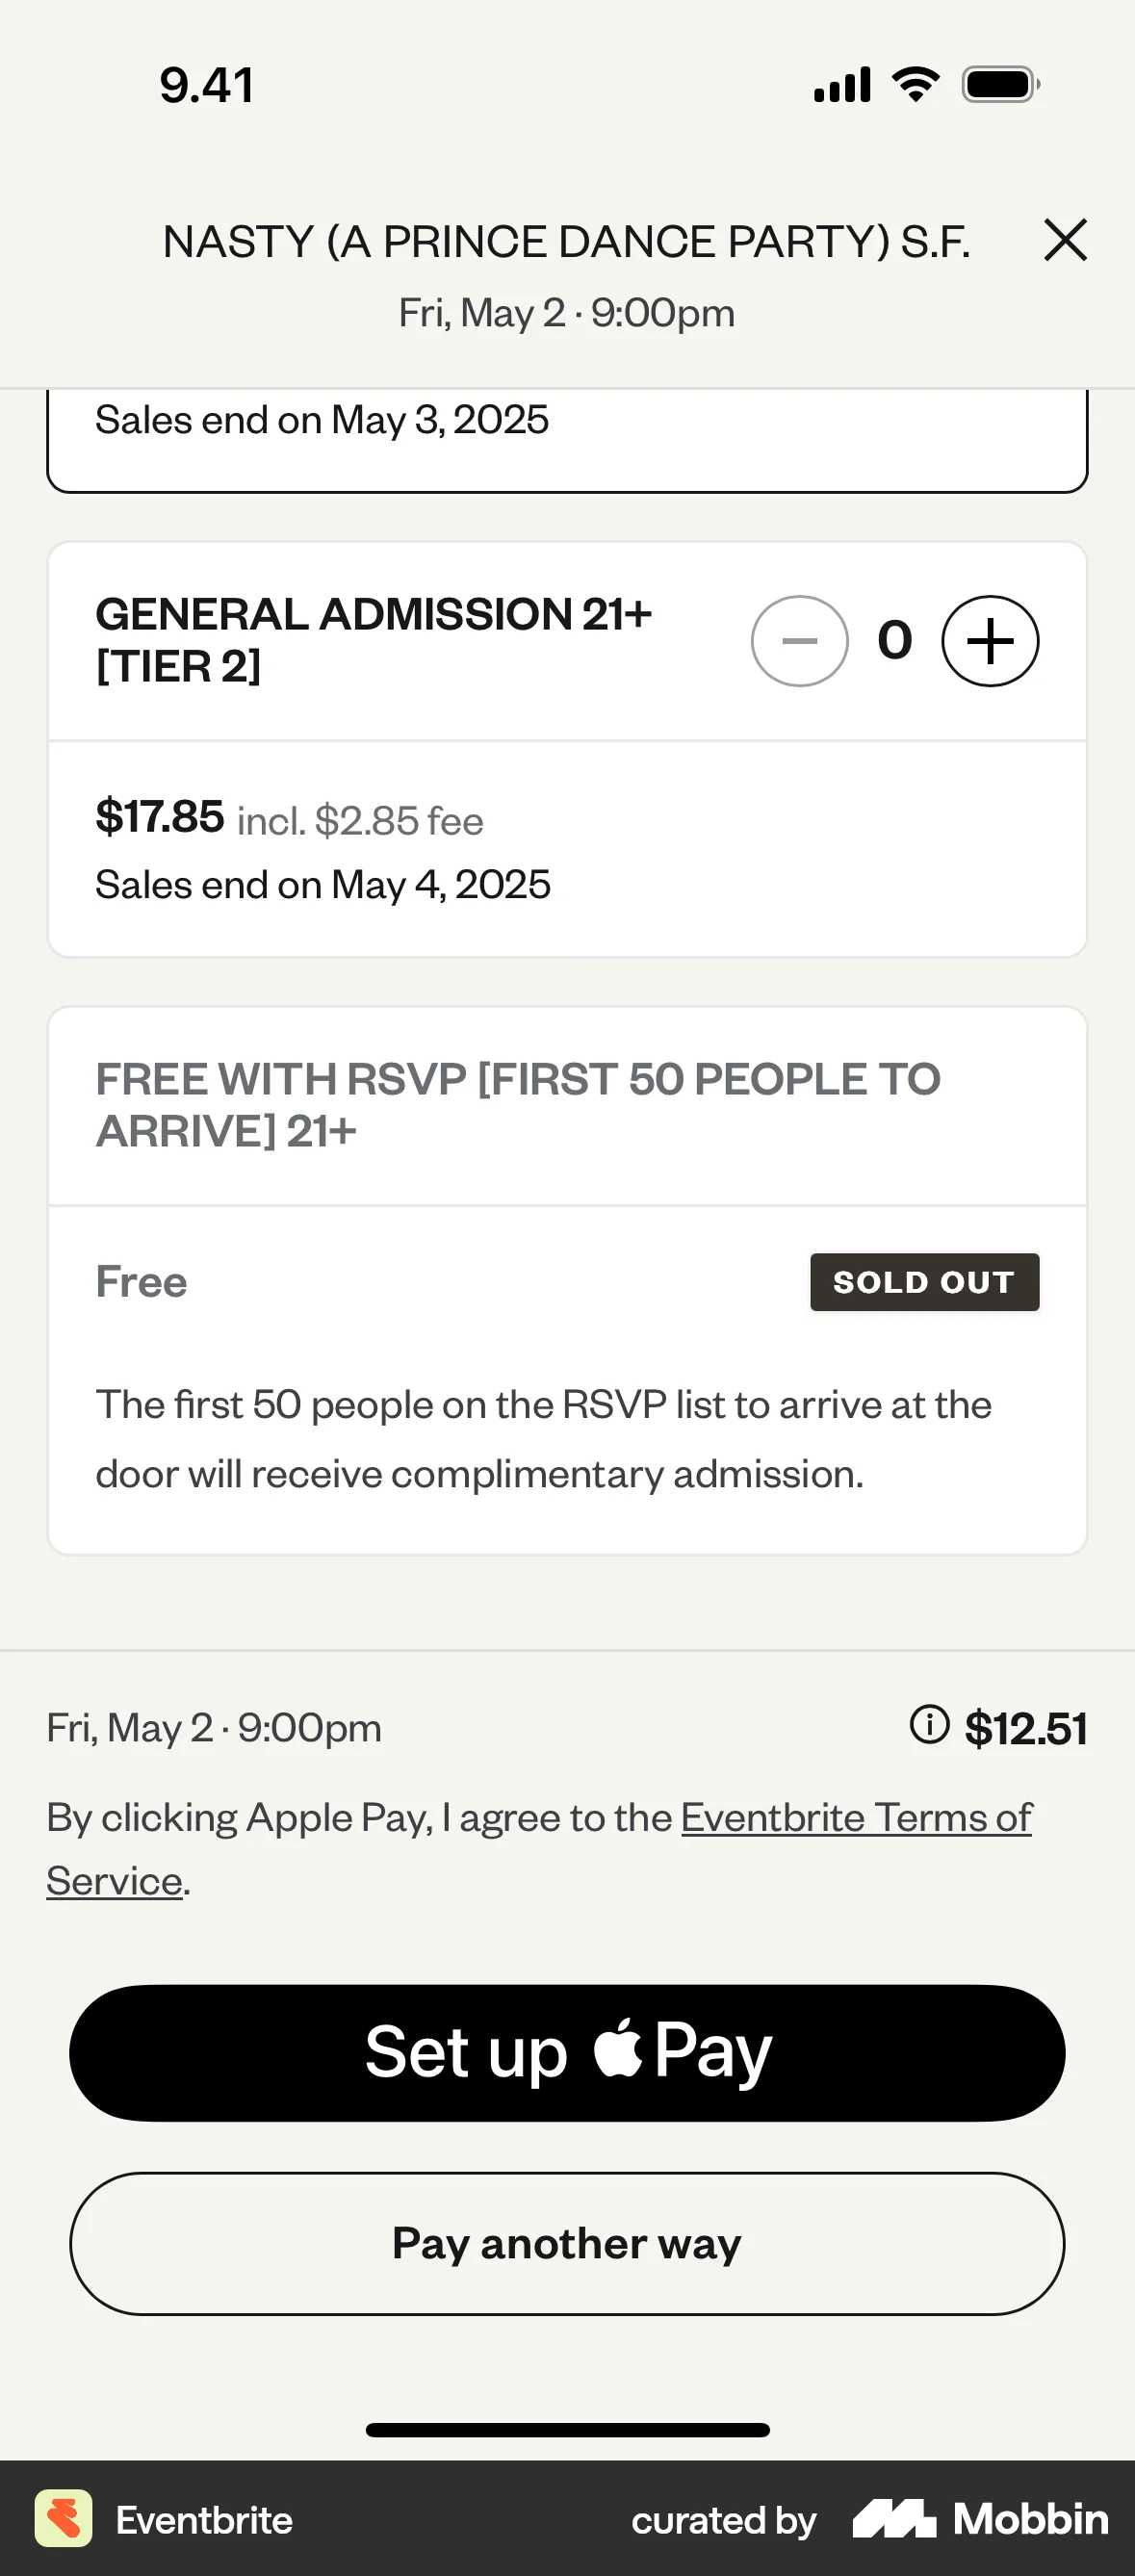
Measuring it
- Primary: completed-purchase rate and revenue per session in a randomised arm, not before-and-after. With I² near 84% in the pooled literature, no published figure transfers to your funnel.
- Split the revenue change into purchase rate and average order value conditional on purchase. Roughly 28% of the StubHub revenue effect was people trading up rather than more people buying, and only one of those two survives an honest total.
- Backfire metric for the surprise: drop-off at the exact step the fee appears. Back-end-fee users were about 45% less likely to complete at checkout even while buying more overall.
- Backfire metric for the regret: the share of users who end up on an option costing more than the one they rejected, wherever you can reconstruct the choice set. It ran 24.5% against 7.8% under dripping.
- Backfire metrics for the misunderstanding: refund and chargeback rate, first-week cancellations, and support contacts asking what a fee is. Before launch, ask a sample what they will be charged at the screen where the choice is made.
References
- Morwitz, Greenleaf & Johnson (1998). Divide and Prosper: Consumers' Reactions to Partitioned Prices. Journal of Marketing Research.
- Greenleaf, Johnson, Morwitz & Shalev (2016). The price does not include additional taxes, fees, and surcharges: A review of research on partitioned pricing. Journal of Consumer Psychology.
- Abraham & Hamilton (2018). When Does Partitioned Pricing Lead to More Favorable Consumer Preferences?: Meta-Analytic Evidence. Journal of Marketing Research.
- Abraham (2015). A Multi-Method Examination of Partitioned Pricing. PhD dissertation, University of Maryland.
- Chetty, Looney & Kroft (2009). Salience and Taxation: Theory and Evidence. American Economic Review.
- Blake, Moshary, Sweeney & Tadelis (2021). Price Salience and Product Choice. Marketing Science.
- Santana, Dallas & Morwitz (2020). Consumer Reactions to Drip Pricing. Marketing Science.
- Hossain & Morgan (2006). …Plus Shipping and Handling: Revenue (Non)Equivalence in Field Experiments on eBay. Advances in Economic Analysis & Policy.
- Huck, Schmid & Wallace (2013). Price Framing. WZB Berlin Social Science Center, Discussion Paper SP II 2013-314.
- Rasch, Thöne & Wenzel (2020). Drip pricing and its regulation: Experimental evidence. Journal of Economic Behavior & Organization.
- FTC (2025). Trade Regulation Rule on Unfair or Deceptive Fees, 16 CFR Part 464. 90 Fed. Reg. 2066, effective 12 May 2025.
- Digital Markets, Competition and Consumers Act 2024, section 230 — omission of material information from an invitation to purchase.
- Directive 2005/29/EC (Unfair Commercial Practices Directive), Article 7(4) — material information in an invitation to purchase.
- Directive 2011/83/EU (Consumer Rights Directive), Article 6(1)(e) — total price inclusive of taxes and additional charges.
For agents
An agent-friendly guide to this principle lives at /agents/partitioned-pricing.md.
Our MCP server and skills for all principles are coming soon.
Similar principles
Disclaimer: The theories here are just that — theories. They may not apply universally and should be considered in context. Use your own judgment and consult additional sources when applying these principles.