Picture superiority effect
Pictures are encoded more distinctively than words, which makes them easier to find again. The advantage belongs to the distinctiveness, not to being an image, and it only pays off when the thing to be remembered is the picture's content.
The asymmetry is old and robust. Across Standing's four single-trial learning experiments on recognition, recall and choice reaction time, memory capacity followed a power law of the amount presented, pictures beat words throughout, and adding alternatives to the recognition test left the picture advantage intact. One result from the same paper is rarely quoted — verbal memory showed a higher retrieval speed than picture memory. Brady and colleagues put a ceiling on picture capacity rather than on the comparison: after viewing 2,500 objects over 5.5 hours, participants picked the seen image out of a pair at 92% against a foil from a novel category, 88% against another exemplar of the same category and 87% against the same object in a different state. That study had no word condition, so it shows how much detail an image holds, not that an image beats a label.
Hockley pushed the effect past single-item recognition. Students studied random pairs of concrete words or of line drawings, then separated intact pairs from rearranged ones; pictures won here too, entirely on a higher hit rate for intact picture pairs, with no difference in false alarms. The advantage persisted when the test pairs were the verbal labels of the pictures studied — the gain is made at encoding, so it is the drawing you show rather than how you later ask about it that does the work.
The standard explanation has since lost, and that changes what you draw. Dual coding attributed the advantage to a picture being spontaneously named as well as seen. Ensor, Surprenant and Neath instead varied physical distinctiveness: half the words in plain black type, half in varying fonts, sizes, colours and capitalisation; half the pictures in colour, half in black and white. Against distinctive words, black-and-white pictures lost their advantage entirely. Higdon and colleagues reproduced the pattern in associative recognition and free recall and concluded that dual coding is no longer viable. A screen of fifteen illustrations in one house style, one palette and one size has bought pictures and no distinctiveness.
It also reverses on the retrieval cue. Weldon, Roediger and Challis found words remembered better than pictures on word-fragment and word-stem completion — finishing -l-ph-nt or ele----- — under both implicit and explicit instructions, while pictures won when the cue was a semantically related word from outside the list, and words won again when both cue types were combined under implicit instructions. The cue decided the outcome, not the instruction. If what the user does later is type a word, scan a text label or spot a term in an email, the picture advantage is not in play, and verbal memory is the faster one — which is the case against an icon-only control.
In applied settings the effect is real and smaller than its reputation. Guo, Zhang, Landau Wright and McTigue meta-analysed 39 experiments and found a moderate effect of adding graphics to text on reading comprehension, Hedges's g = 0.39, holding across grade levels, with pictures, pictorial diagrams and flow diagrams not differing significantly from one another. Lindner tested the distinction interfaces usually ignore: across 404 students, a representational picture beside a science or maths item raised performance, perceived ease and test-taking pleasure, while a decorative one moved neither performance nor perceived ease and cut time on task in maths items. Houts and colleagues' health communication review names the conditions: pictures closely linked to the words beside them raise attention and recall, help most when they show relationships among ideas or spatial relationships, help low-literacy readers most, and want plain captions without distracting detail.
The field trials mark the limits. Noar and colleagues pooled 37 experiments, 48 samples, N = 33,613, on pictorial against text-only cigarette pack warnings: more attention (d = 0.79), far more cognitive elaboration (d = 1.70), stronger negative affect and higher intention to quit (both d = 0.54), more psychological reactance (d = −0.50) — and no better recall or recognition of the warning text at all (d = −0.03, not significant), no change in perceived likelihood of harm (d = 0.02) or self-efficacy (d = 0.01). Nine of the 17 pooled effects were heterogeneous, and only one study measured smoking behaviour. In Durand and colleagues' surgeon-randomised trial of breast cancer surgery conversation aids, the picture aid beat usual care on knowledge where the text-only aid did not, with more impact among women of lower socioeconomic status and health literacy — but the two aid arms did not differ significantly from each other. Scalia and colleagues randomised 407 people to an icon array or a bar graph for the same stroke-and-death risks and found no difference in understanding at any level of numeracy or graph literacy, though 34% preferred the icon array. Dowse and colleagues tested 10 pharmaceutical pictograms with 90 isiXhosa-speaking adults: mean comprehension 7.9 out of 10, 8 of the 10 meeting the ISO criterion of 66.7% correct, comprehension associated with health literacy (p = 0.002), age, education and English proficiency. A symbol is not self-explanatory; it is something your audience has to already read.
Memory for pictures is confident rather than accurate. Weinstein and Shanks showed participants object pictures, then a word list quietly including names of objects never shown; participants later claimed with high confidence and a feeling of recollection that they had seen pictures of those objects, while still telling studied pictures from new ones accurately. So the usable claim is narrow: a picture that carries the content, looks unlike the pictures around it, sits next to the words it explains and is retrieved by something visual is remembered better than the words alone. A decorative image on the same text buys attention and feeling, and in the one large meta-analysis that measured it the text was remembered no better at all.
When it holds
- The picture is physically distinct from its neighbours. The effect was eliminated when black-and-white pictures were compared with words set in varying fonts, sizes, colours and capitalisation, and the same pattern held in associative recognition and free recall.
- The picture carries the content, not the mood. Representational pictures raised performance, perceived ease and test-taking pleasure across 404 students, while decorative pictures moved none of those and cut time on task in maths items.
- What has to be remembered is the picture's subject. Pictorial cigarette warnings beat text-only warnings on attention (d = 0.79) and elaboration (d = 1.70) but not on recall or recognition of the warning text (d = −0.03, not significant).
- The later retrieval cue is visual, not a word fragment. Words beat pictures on word-fragment and word-stem completion under both implicit and explicit instructions, and verbal memory showed the higher retrieval speed in the experiments that established the capacity advantage.
- The reader is low-literacy, low-numeracy or unfamiliar with the material. The picture-based conversation aid's knowledge gain over usual care was larger among women of lower socioeconomic status and health literacy, and reviews find low-literacy patients benefit most.
- The symbol is already legible to this audience. Pictogram comprehension averaged 7.9 of 10 and only 8 of 10 pictograms met the ISO 66.7% criterion, with comprehension tied to health literacy (p = 0.002), age, education and language proficiency.
- It is a comprehension aid, not a format rule or a decision lever. Understanding of the same risk did not differ between an icon array and a bar graph across 407 randomised participants, and adding pictures to a decision aid raised knowledge and lowered regret while changing neither treatment choice nor anxiety.
How to apply
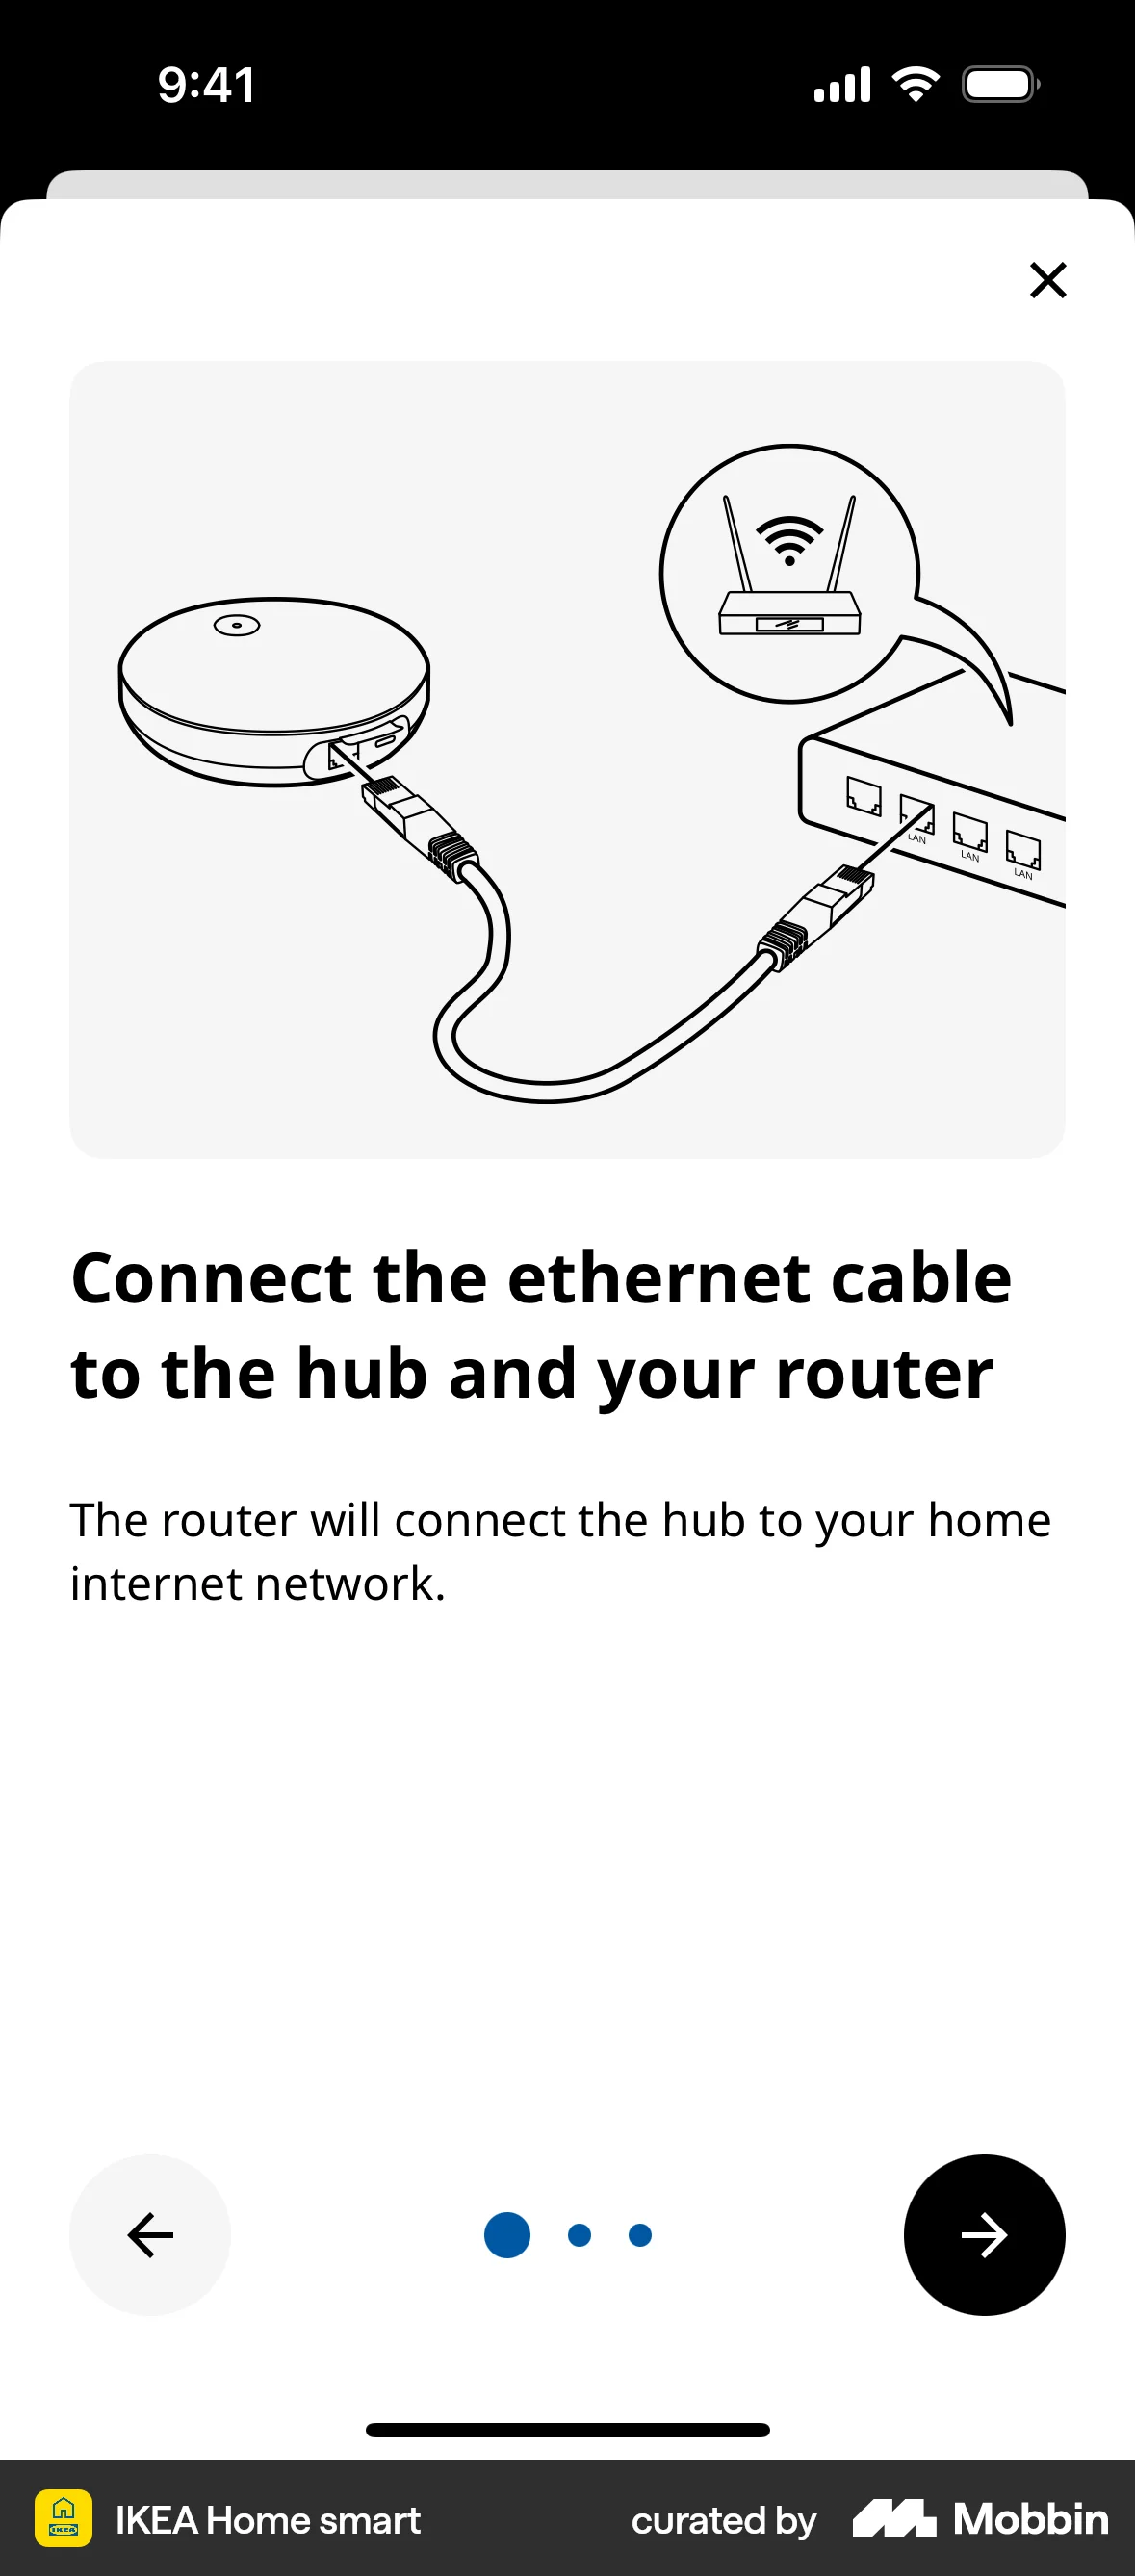
- Illustrate the one or two concepts the user has to carry to a later screen — what a workspace is, what syncing does, what the connected account will see — and leave the rest as text. Spend that budget on onboarding and first-run explanation, where the reader is least familiar with the material.
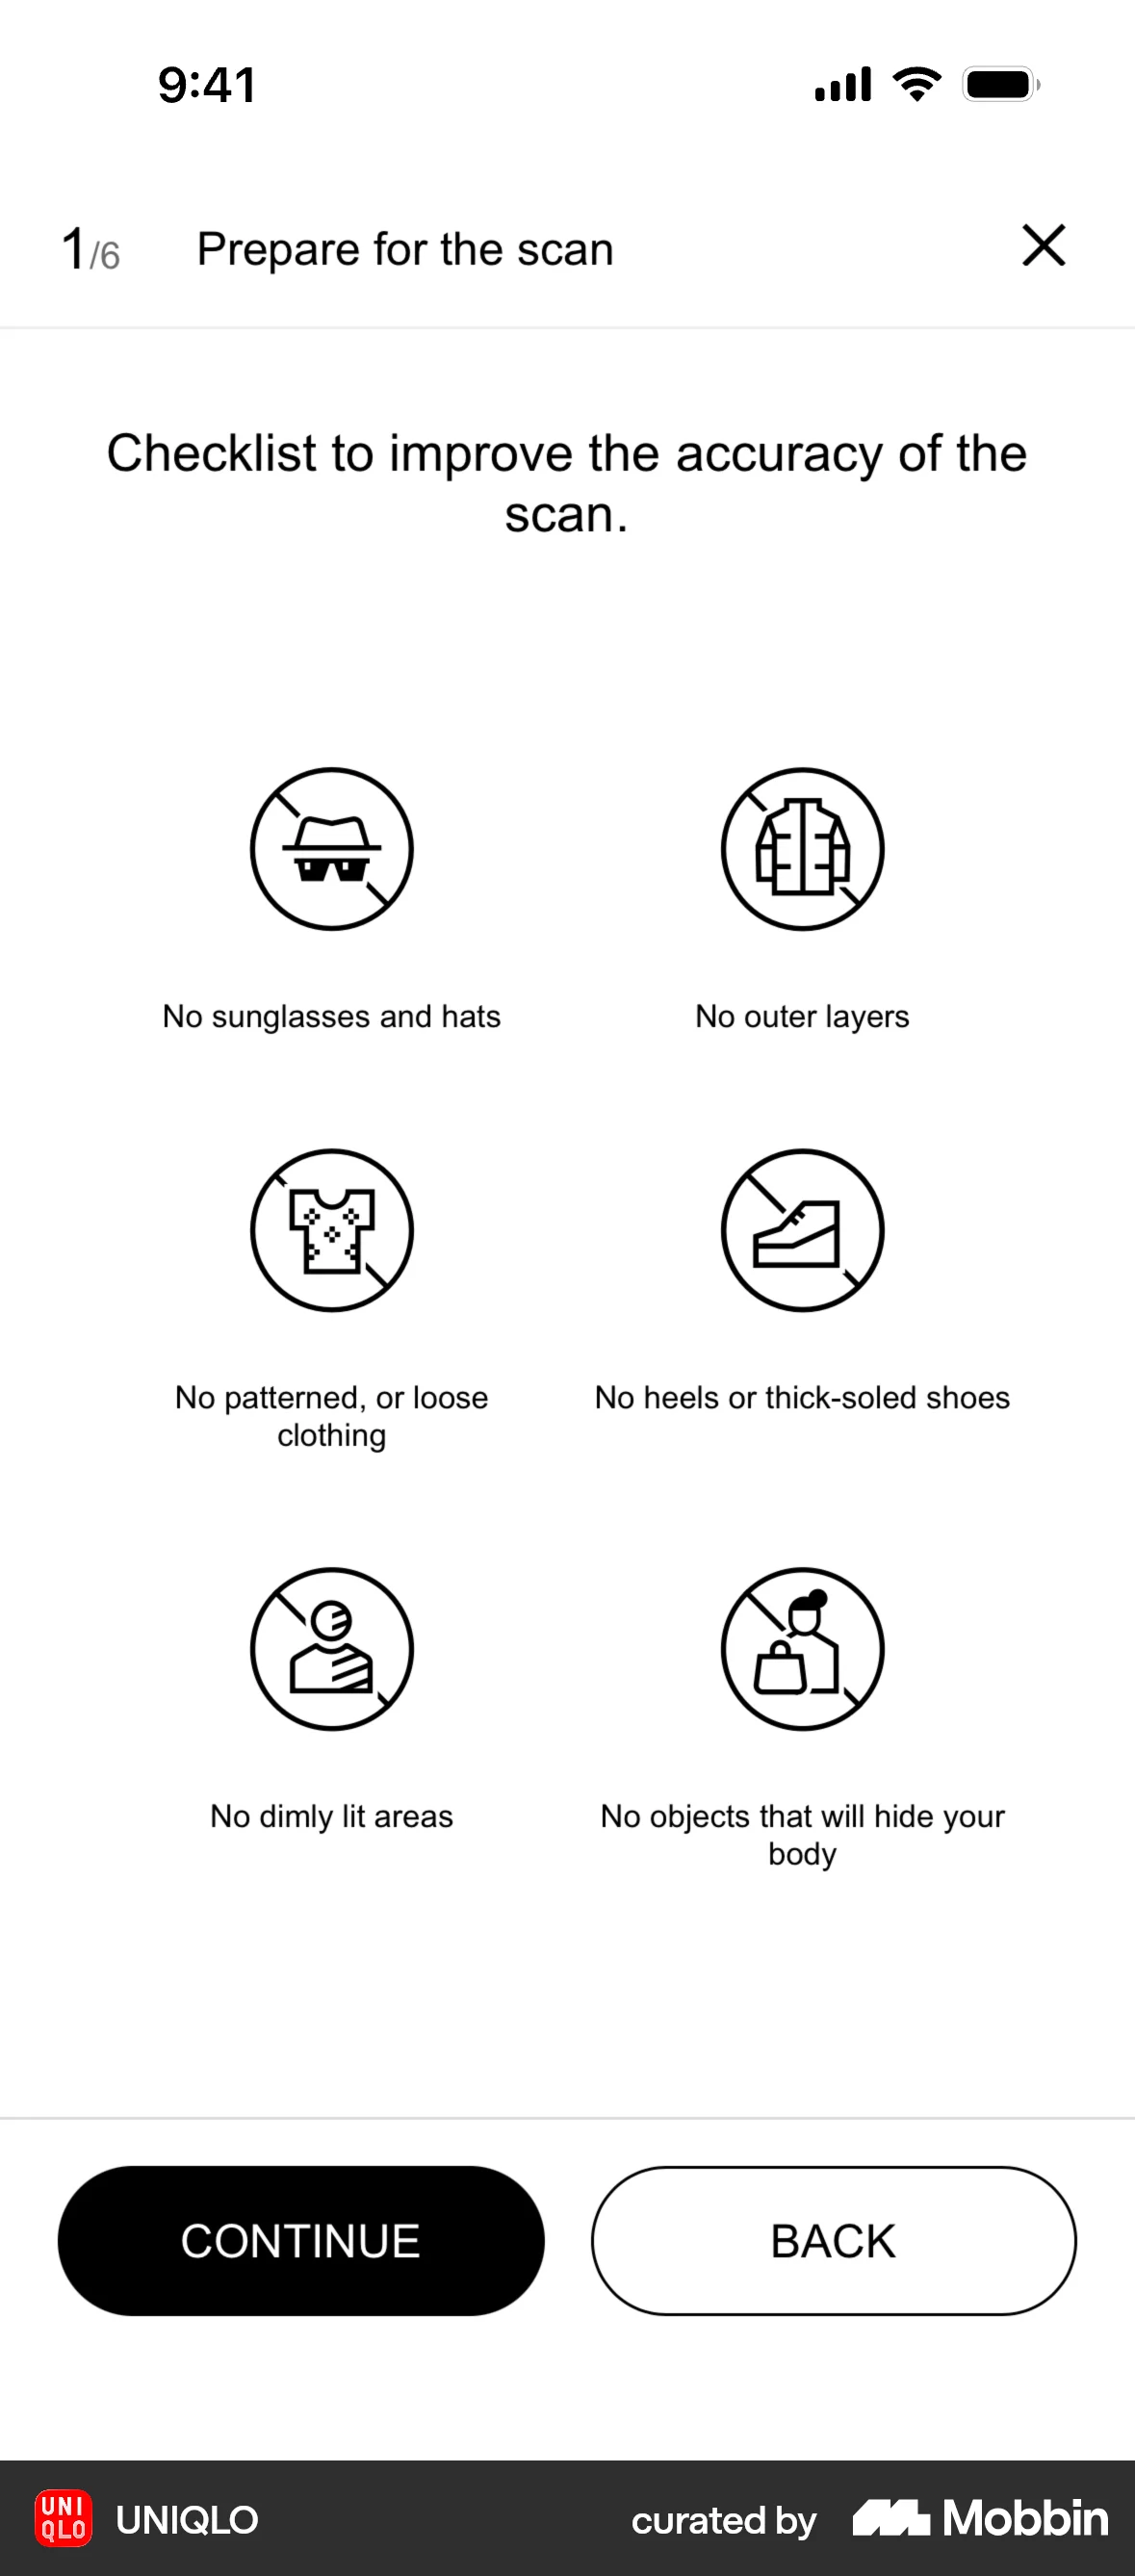
- Draw each item in a set so it is unmistakable at a glance: different silhouette, different colour, different composition. A uniform illustration style across every empty state removes the distinctiveness the effect runs on.
- Put a short, plainly worded caption directly under the image rather than a paragraph elsewhere on the page. Closely linked picture-and-text is the condition under which attention and recall rose.
- Use an image where prose has to describe a structure the reader must reconstruct — how two plans differ, which part of the invoice the fee sits in, where the sensor goes.
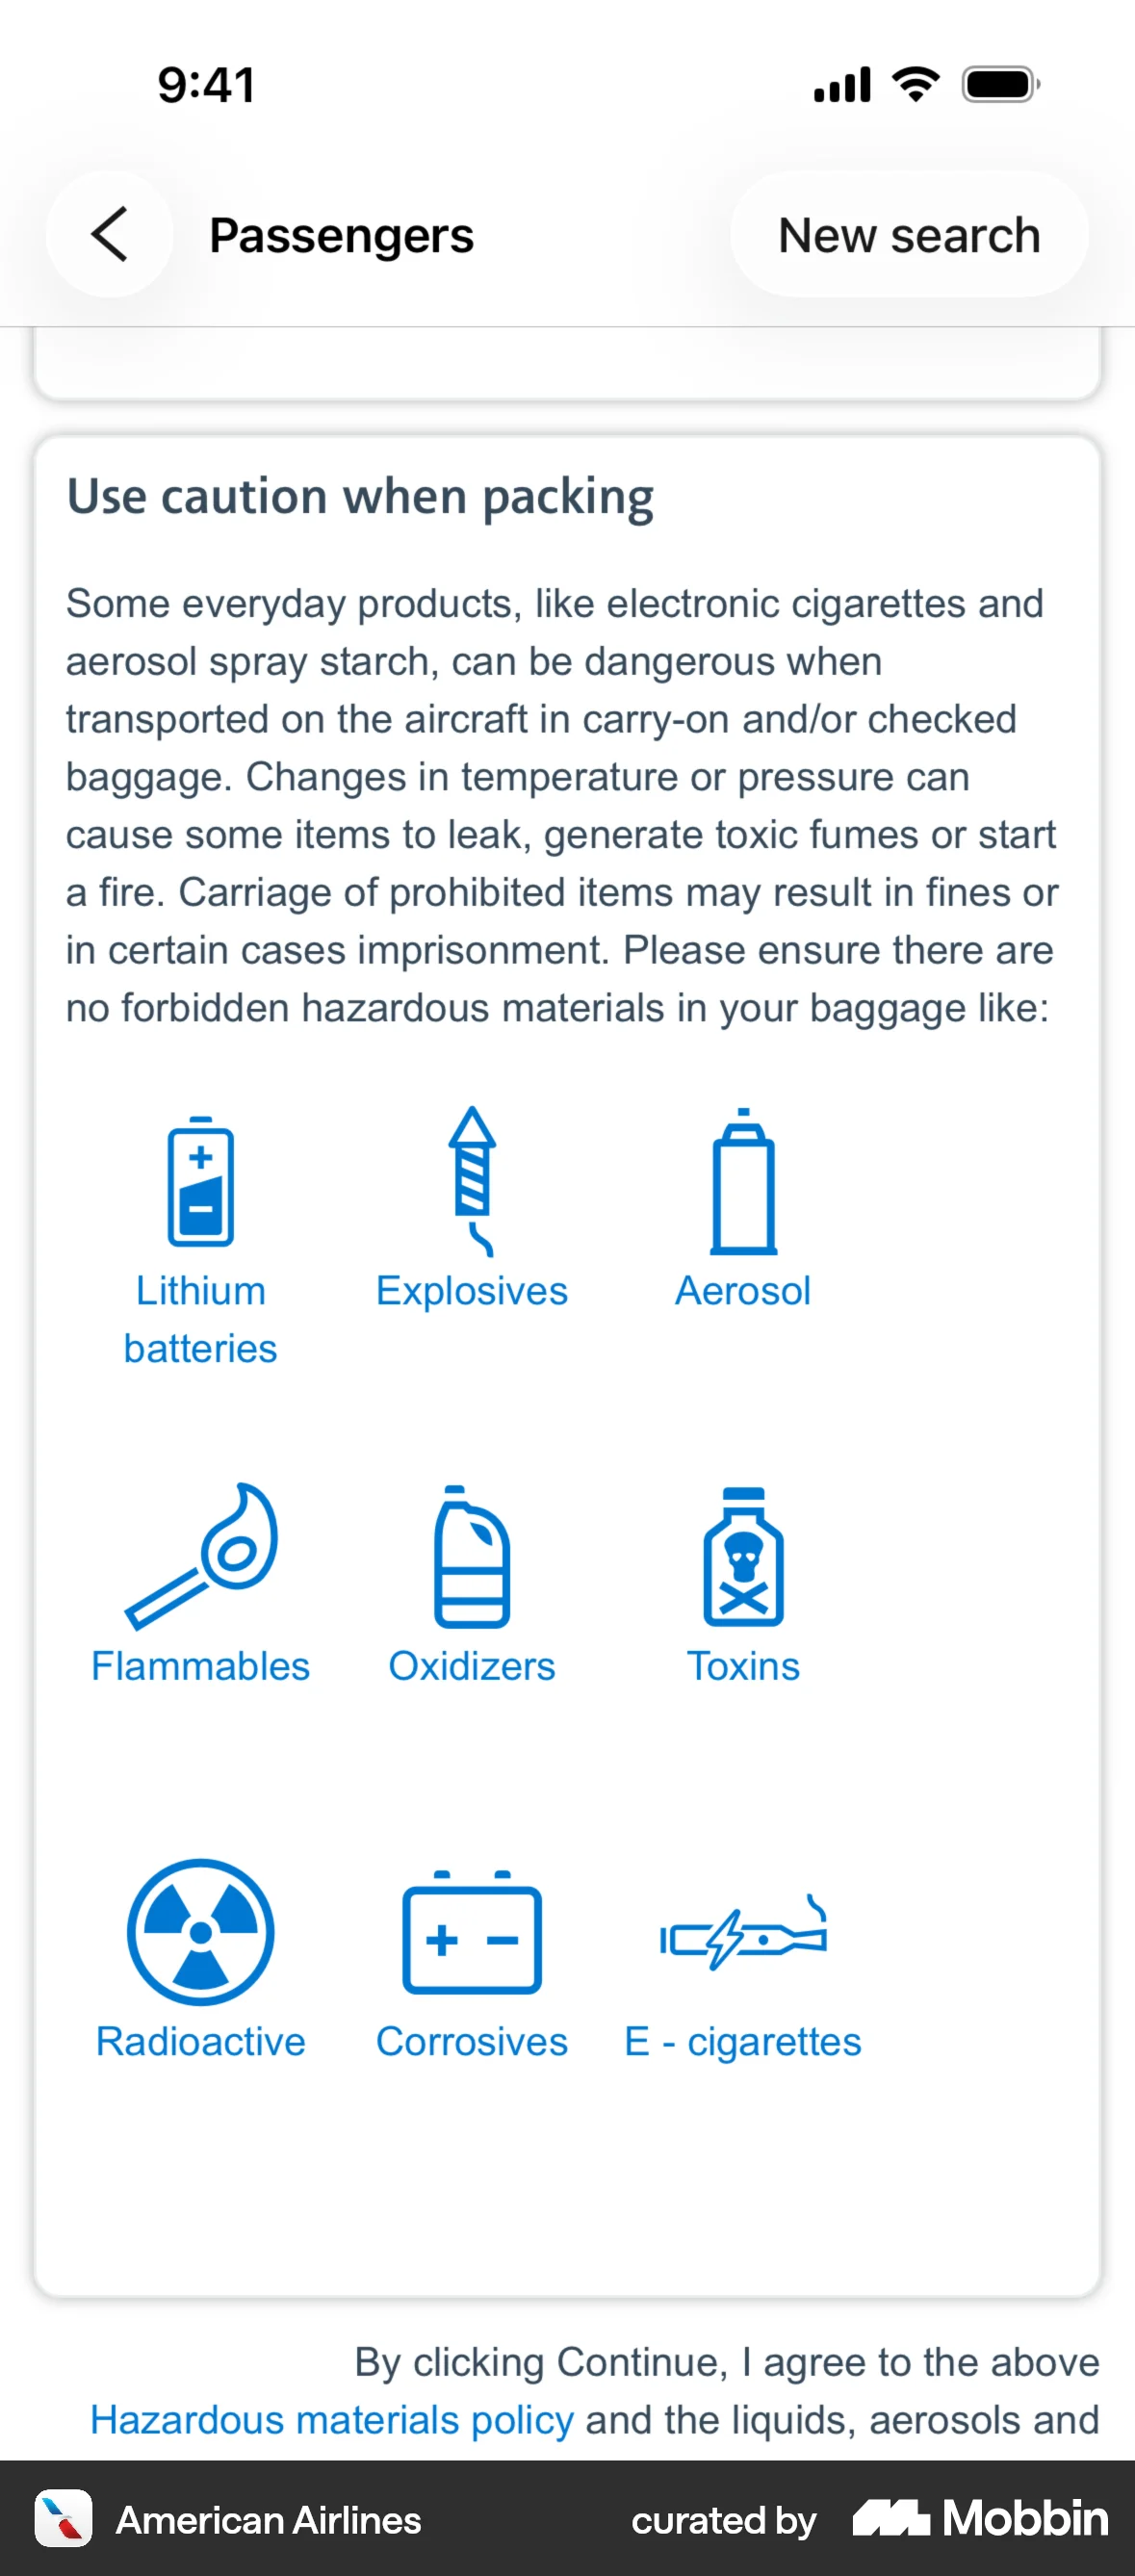
- Give each feature row in a plan comparison a distinct icon beside the label rather than instead of it, so the row is recognisable on the return visit while the word stays searchable and screen-reader-legible.
- Label every icon the user has to act on with visible text, not a tooltip. Words are retrieved faster than pictures, and a symbol only clears a comprehension bar for the audience that already knows it.
- Test any pictogram meant to carry meaning alone — a status badge, a safety step, a dosage instruction — against a comprehension threshold with your own users, and redraw the ones that miss. Only 8 of 10 professionally developed pharmaceutical pictograms met the 66.7% ISO criterion.
What to avoid
- Decorating. A picture with no relation to the claim beside it did not improve performance or perceived ease in a 404-student experiment, and reduced time spent on the item it accompanied.
- Putting words inside images. WCAG 2.2 Success Criterion 1.1.1 Non-text Content (Level A) requires a text alternative serving the equivalent purpose, and 1.4.5 Images of Text (Level AA) requires real text wherever the technology can achieve the visual presentation; a screenshot of a pricing table is unsearchable, unzoomable and unreadable to a screen reader.
- Dropping the text label because the icon is “obvious”. Comprehension of professionally designed symbols varied with the viewer's literacy, age, education and language, so an icon-only control is an unlabelled control for everyone outside the designer's reference group.
- Using an emotive image to carry a claim the words do not make — a stock photo of a family beside an insurance tier, a graph shape with no axis. Pictorial warnings produced the strongest emotional and elaborative response of any outcome measured and still left the written facts no better remembered.
- Treating a picture as proof. Participants who saw object pictures and then a word list containing names of unseen objects later claimed, confidently and with a sense of recollection, that they had seen pictures of those objects.
- Over-stimulating the audience you meant to help. Pictorial warnings raised psychological reactance (d = −0.50) alongside their benefits, so a frightening or shaming image can push the user away from the action it was meant to support.
- Repeating the folk statistics. The widely quoted retention percentages for “what we see” versus “what we read” come from none of the studies above; the measured effect on comprehension across 39 experiments is a moderate g = 0.39.
Real-world examples


Measuring it
- Primary metric: unaided comprehension of the thing the picture explains, asked after the screen is gone — a one-question check on the next step, or support contacts about that concept — rather than time on the illustrated screen.
- Secondary: correct task completion on the return visit, split by first-time and returning users and by any literacy or locale proxy you hold. The applied gains were largest for the least familiar readers.
- Run the variant you can learn from: representational picture against decorative picture against text alone. Picture-versus-nothing cannot tell you whether the content or the ornament did the work.
- Backfire metric: comprehension of the surrounding text, not only of the image. The largest meta-analysis measuring it found pictorial versions no better recalled on the written message (d = −0.03).
- Backfire metric: false confidence and accessibility regressions — users who fail a comprehension check while reporting they understood, tickets asserting a feature the illustration implied, and images shipped with empty, duplicated or text-bearing alt content.
References
- Standing (1973). Learning 10,000 pictures. Quarterly Journal of Experimental Psychology, 25(2), 207–222.
- Brady, Konkle, Alvarez & Oliva (2008). Visual long-term memory has a massive storage capacity for object details. Proceedings of the National Academy of Sciences, 105(38), 14325–14329.
- Hockley (2008). The picture superiority effect in associative recognition. Memory & Cognition, 36(7), 1351–1359.
- Ensor, Surprenant & Neath (2018). Increasing word distinctiveness eliminates the picture superiority effect in recognition: evidence for the physical-distinctiveness account. Memory & Cognition, 47(2), 182–193.
- Higdon, Neath, Surprenant & Ensor (2024). Distinctiveness, not dual coding, explains the picture-superiority effect. Quarterly Journal of Experimental Psychology, 78(1), 180–191.
- Weldon, Roediger & Challis (1989). The properties of retrieval cues constrain the picture superiority effect. Memory & Cognition, 17(1), 95–105.
- Guo, Zhang, Landau Wright & McTigue (2020). Do you get the picture? A meta-analysis of the effect of graphics on reading comprehension. AERA Open, 6(1).
- Lindner (2020). Representational and decorative pictures in science and mathematics tests: do they make a difference? Learning and Instruction, 68, 101345.
- Houts, Doak, Doak & Loscalzo (2006). The role of pictures in improving health communication: a review of research on attention, comprehension, recall, and adherence. Patient Education and Counseling, 61(2), 173–190.
- Noar, Hall, Francis, Ribisl, Pepper & Brewer (2016). Pictorial cigarette pack warnings: a meta-analysis of experimental studies. Tobacco Control, 25(3), 341–354.
- Durand, Yen, O'Malley et al. (2021). What matters most: randomized controlled trial of breast cancer surgery conversation aids across socioeconomic strata. Cancer, 127(3), 422–436.
- Scalia, Schubbe, Lu, Durand, Frascara, Noel, O'Malley & Elwyn (2021). Comparing the impact of an icon array versus a bar graph on preference and understanding of risk information: results from an online, randomized study. PLOS ONE, 16(7), e0253644.
- Dowse, Okeyo, Sikhondze & Khumalo (2023). Pharmaceutical indication pictograms for low literacy viewers: health literacy and comprehension. Health SA Gesondheid, 28, 2192.
- Weinstein & Shanks (2010). Rapid induction of false memory for pictures. Memory, 18(5), 533–542.
- W3C (2023). Web Content Accessibility Guidelines (WCAG) 2.2, Success Criteria 1.1.1 Non-text Content and 1.4.5 Images of Text.
For agents
An agent-friendly guide to this principle lives at /agents/picture-superiority-effect.md.
Our MCP server and skills for all principles are coming soon.
Similar principles
Disclaimer: The theories here are just that — theories. They may not apply universally and should be considered in context. Use your own judgment and consult additional sources when applying these principles.