Compromise effect
Extremeness aversion: people judge each option against the range in front of them, so an option at either end carries an obvious worst-on-something complaint while the one in between looks balanced and defensible.
Simonson (1989) built the effect on reasons rather than utilities: you pick the option you can most easily defend, and the one that is not worst on anything is easiest to defend. Across five product categories an option's share was on average 17.5 percentage points higher as the middle of its set than as an extreme, significant in nine of eleven comparisons: a $299 television took 23% of choices as the cheap edge and 48% as the middle, a 12-hour calculator battery 40% against 66%. The justification story only half held: expecting to defend the choice out loud moved the compromise effect by 2.6 points, not significant, though the same manipulation did move the attraction effect. Build for a visible trade-off, not for people rehearsing a reason.
Simonson and Tversky (1992) named the mechanism extremeness aversion and ran it on real catalogue pages. Against a $169.99 Minolta X-370, a $239.99 Maxxum 3000i split subjects 50/50; adding a $469.99 Maxxum 7000i made it 22/57/21, lifting the 3000i's share against the cheap body from 50% to 72%. The shift held among subjects who had first reviewed five cameras, ruling out the third option merely teaching people what the market costs. A dearer tier changes how a price you already sell reads.
The effect survives careful replication. Kivetz, Netzer and Srinivasan (2004) ran about a thousand respondents through overlapping triples of Pareto-optimal portable PCs and speakers: all eight tests were significant, with relative-share shifts of 15% to 34%, mean 24%. A second study of five PCs held the direction in all five contrasts and significance in four, 2% to 32%, mean 17%, with price an attribute for speakers and absent for PCs. Neumann, Böckenholt and Sinha's (2016) meta-analysis of 142 experimental observations calls extremeness aversion robust while finding its magnitude varies up to threefold with method: price-quality trade-offs, nondurable categories and binary-to-trinary comparisons shrink it, whereas more trade-off dimensions, non-numeric attributes, high-quality extensions and utilitarian products enlarge it. Those moderators run opposite to the attraction effect's, which in the replication literature needs every attribute to be a bare number, so a feature table mixing words and numbers suits this effect and not a decoy.
Position is not the mechanism, and this is the finding most pricing-page advice gets wrong. Chernev (2004) showed the compromise is the attribute-balanced option — equal ratings across attributes — wherever it sits. With no balanced option present, adding an adjacent alternative raised the middle option's relative share by 6.1 percentage points, the textbook result. When the balanced option sat next to the middle instead, the middle option's relative share fell by 12.3 points, a significant reversal; when the balanced option was the middle one, it gained 9.3 points. Only 20.1% of respondents named the middle option as the compromise if an adjacent option was balanced, against 65.5% who named the balanced one. A middle tier that is plainly worst on a row is an edge, whatever the layout says — and this is where the effect parts from the decoy effect, which needs a dominated neighbour rather than a balanced middle.
Two conditions that every real interface violates weaken it. Pettibone (2012) gave people 2, 4, 6 or 8 seconds to choose: no significant preference for the compromise target at 2 or 4 seconds, a significant one at 6 and 8, a trend of about 6 percentage points per second of deliberation. Dhar and Simonson (2003) added the option not to choose anything and found it “strengthens the attraction effect, weakens the compromise effect, and decreases the relative share of an option that is ‘average’ on all dimensions,” because not choosing competes with the safe middle pick. A skimmed pricing table with an exit one click away is close to the worst case.
The field evidence is thin but real, and it points at the range rather than the middle slot. Ekström (2021) randomised 63,494 recipients of a mail fundraiser across three ask strings. Moving $100 from the top of ($10, $50, $100) into the middle of a wider ($10, $50, $100, $250, $500) almost tripled the share giving exactly $100 — a 0.041% base rising by 0.078 percentage points — and raised the donation rate by 0.21 points, so the narrow string had been turning donors away rather than trading them down. But a third string listing only the endpoints, $10 and $500 with a blank, performed identically on both measures (p = .89), with 90% of its donors writing in their own amount against 30% in the explicit-middle condition. Setting the range is the operative instruction; naming a middle is optional. The counts are small: 241 donors, 61 gifts of exactly $100. On soft drink sizes, Sharpe, Staelin and Huber (2008) found adding a 44-ounce option cut 32-ounce buyers' average purchase by 2.58 ounces; their demand model implies a 17% rise in consumption, 17.7 to 20.6 ounces per customer, for a chain swapping a 12-to-32-ounce line-up for a 16-to-44-ounce one — a policy simulation, not observed sales.
It fails in places that look like fair tests, and it is easy to confuse with the layout. Mckay, Kemps, Prichard and Tiggemann (2023) had 216 participants order from online menus carrying three or four of small, regular, large and extra-large: adding a small or an extra-large option did not significantly change how often the large was chosen, and most people took the size labelled “regular” whatever the range, which the authors read as a familiar label doing the work instead. A middle option can also win for reasons unrelated to trade-offs: Valenzuela and Raghubir (2009) found people infer that whatever sits in the centre of a display is the most popular, an effect that disappears when the layout is uninformative or their own preferences are made accessible, and Rodway, Schepman and Lambert (2012) replicated the pull of the centre of five items. If your middle card also carries the badge and the centre slot, you have not learned which of the three moved anything.
Context effects are not consumer-specific — Trueblood, Brown, Heathcote and Busemeyer (2013) produced all three in a perceptual-discrimination task — and the incentive-compatible numbers are the honest ones to plan around. Dumbalska, Li, Tsetsos and Summerfield (2020) found compromise the most reliable of the three classic decoys among 189 participants ranking rental properties for real stakes, with the similarity effect absent entirely, and each decoy shifted preference by about 3 to 5 percentage points. Huber, Payne and Puto (2014), defending their own attraction effect, concede that “although asymmetric dominance may be more robust than compromise in the lab, we more often observe successful use of compromise in the marketplace.” Size the work for a few points, not for the 17 to 24 point swings of forced-choice matrix studies, and not for any published pricing-page experiment, because there is none.
When it holds
- The options are comparable on the same two or three attributes, so there is a trade-off to be split. Neumann and colleagues found larger effects with more trade-off dimensions and non-numeric attributes, smaller ones for pure price-quality trade-offs and nondurable categories.
- The option you want chosen is the balanced one, not just the middle one. In Chernev's experiment the middle option's relative share rose 6.1 points with no balanced rival present and fell 12.3 points when the balanced option sat beside it.
- People spend several seconds comparing. Pettibone found no compromise effect at 2 or 4 seconds of deliberation and a significant one at 6 and 8, a trend of about 6 percentage points per second.
- A choice is actually being made now. Dhar and Simonson showed that adding a no-choice option weakens the compromise effect and cuts the share of the option that is average on everything, because deferring is itself the safe move.
- The endpoints are doing much of the work. In Ekström's field experiment an ask string listing only $10 and $500 raised the share giving $100 and the donation rate exactly as much as one naming $100 in the middle.
- Preferences are uncertain. Simonson built the effect on choice under preference uncertainty, and Valenzuela and Raghubir found the related pull of the centre position disappears once people's own attribute preferences are made accessible.
- Not when one option carries a normative label. Adding a small or extra-large size did not change how often the large was chosen in Mckay and colleagues' menu study; participants took the “regular” option regardless of the range.
- Expect a few points, not a landslide. With incentive-compatible choices Dumbalska and colleagues measured compromise shifts of about 3 to 5 percentage points; the 17 to 24 point figures come from forced choices among abstract attribute matrices.
How to apply
- Choose the two endpoints first. Set the cheapest and the dearest tier to bracket the price you want paid, because in the only randomised field test the range alone moved behaviour as much as a named middle did.
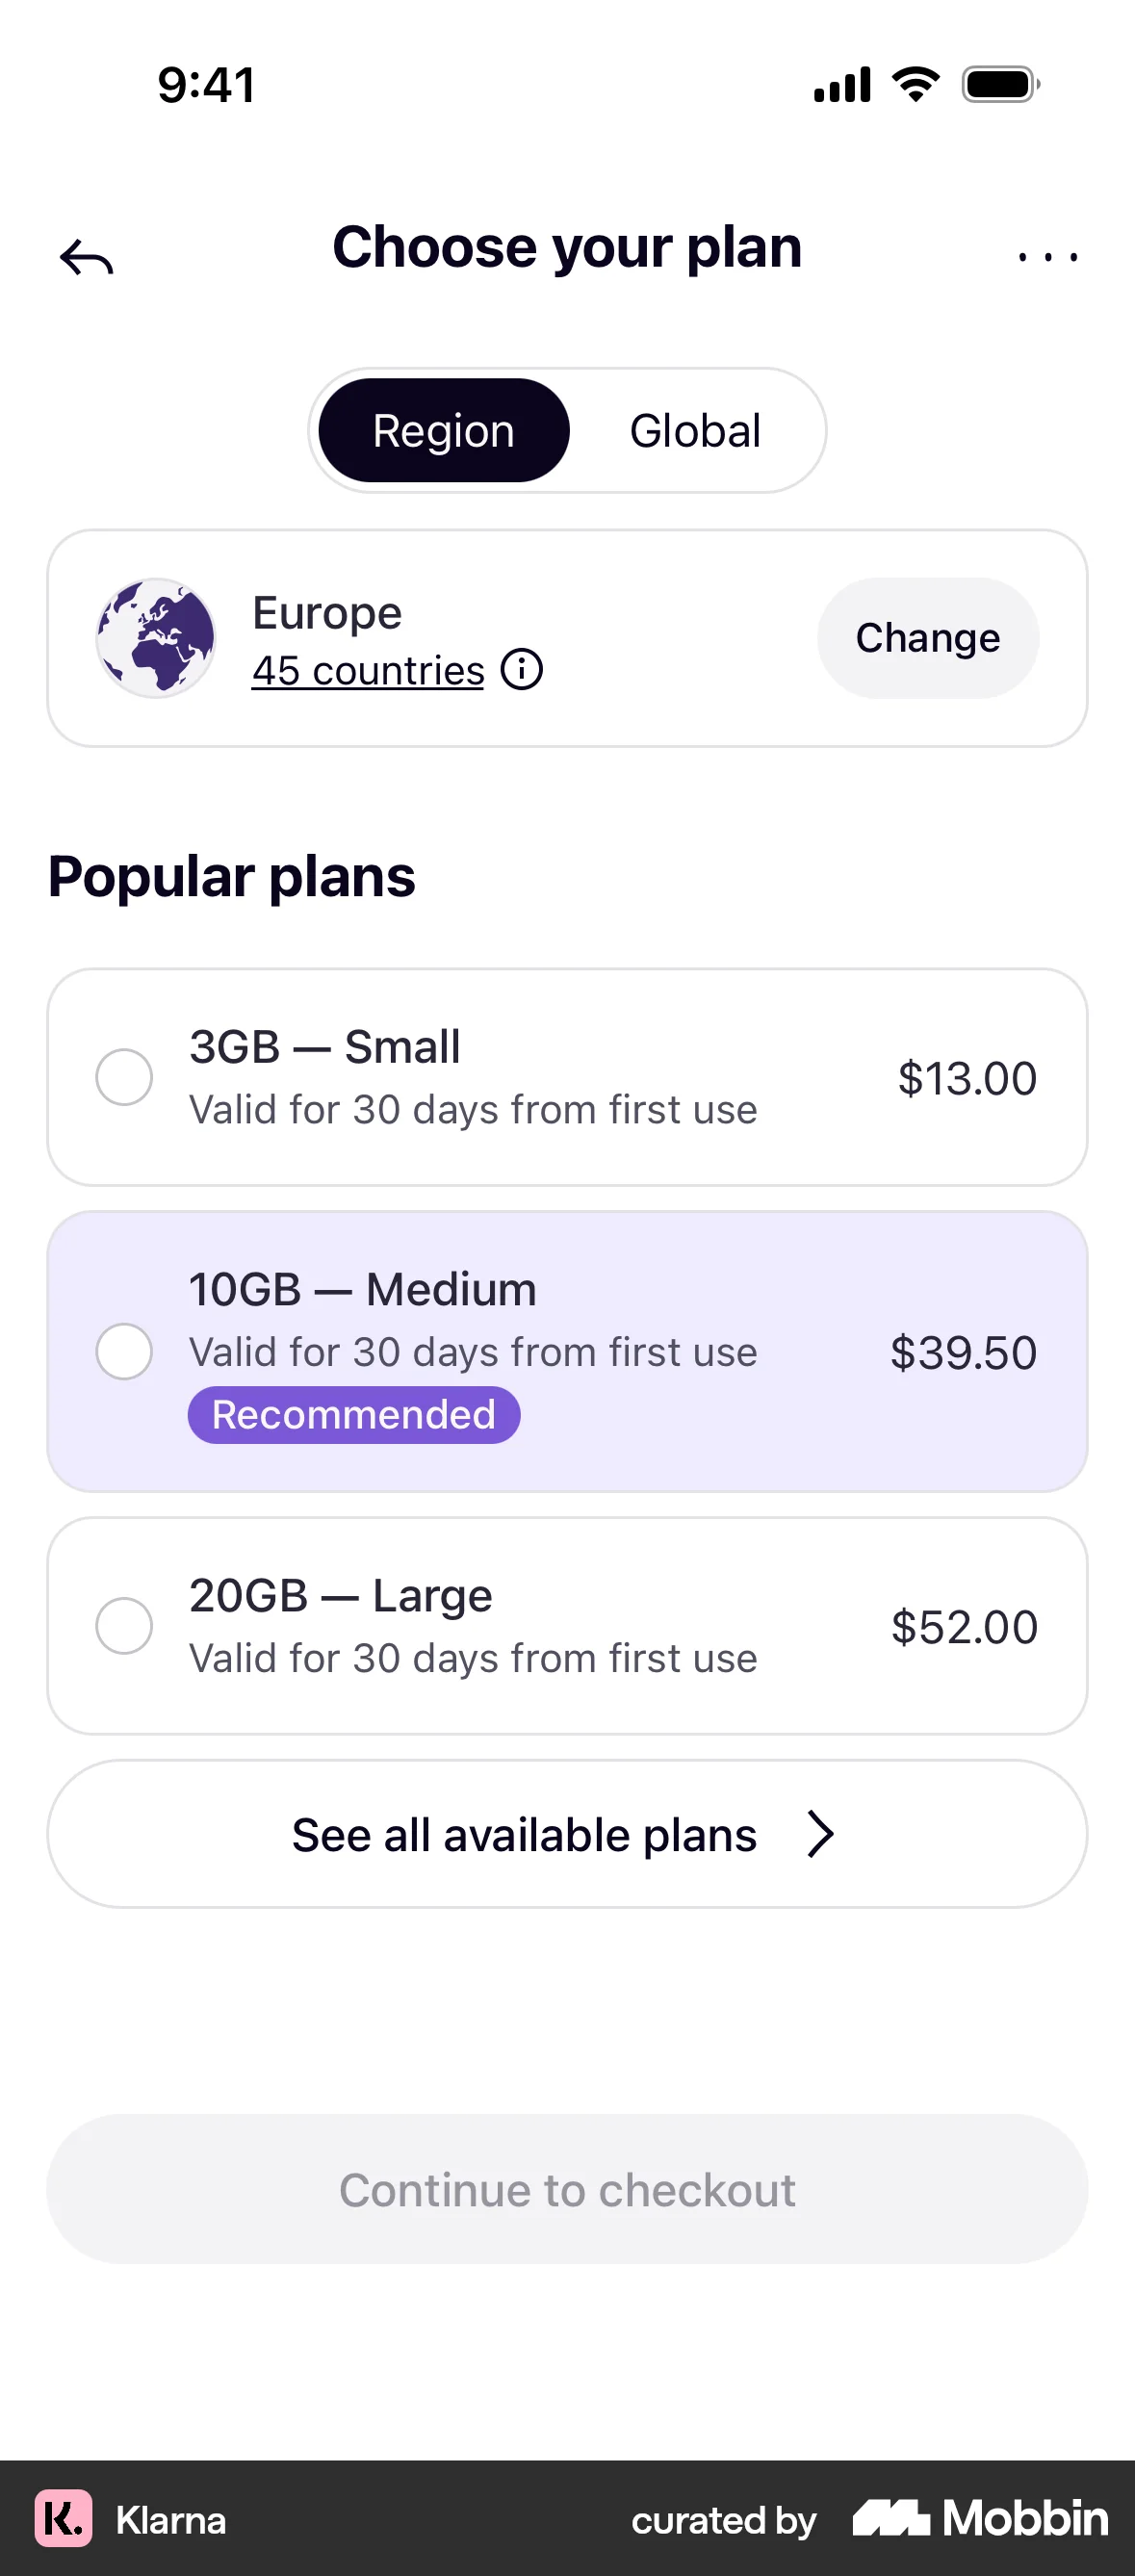
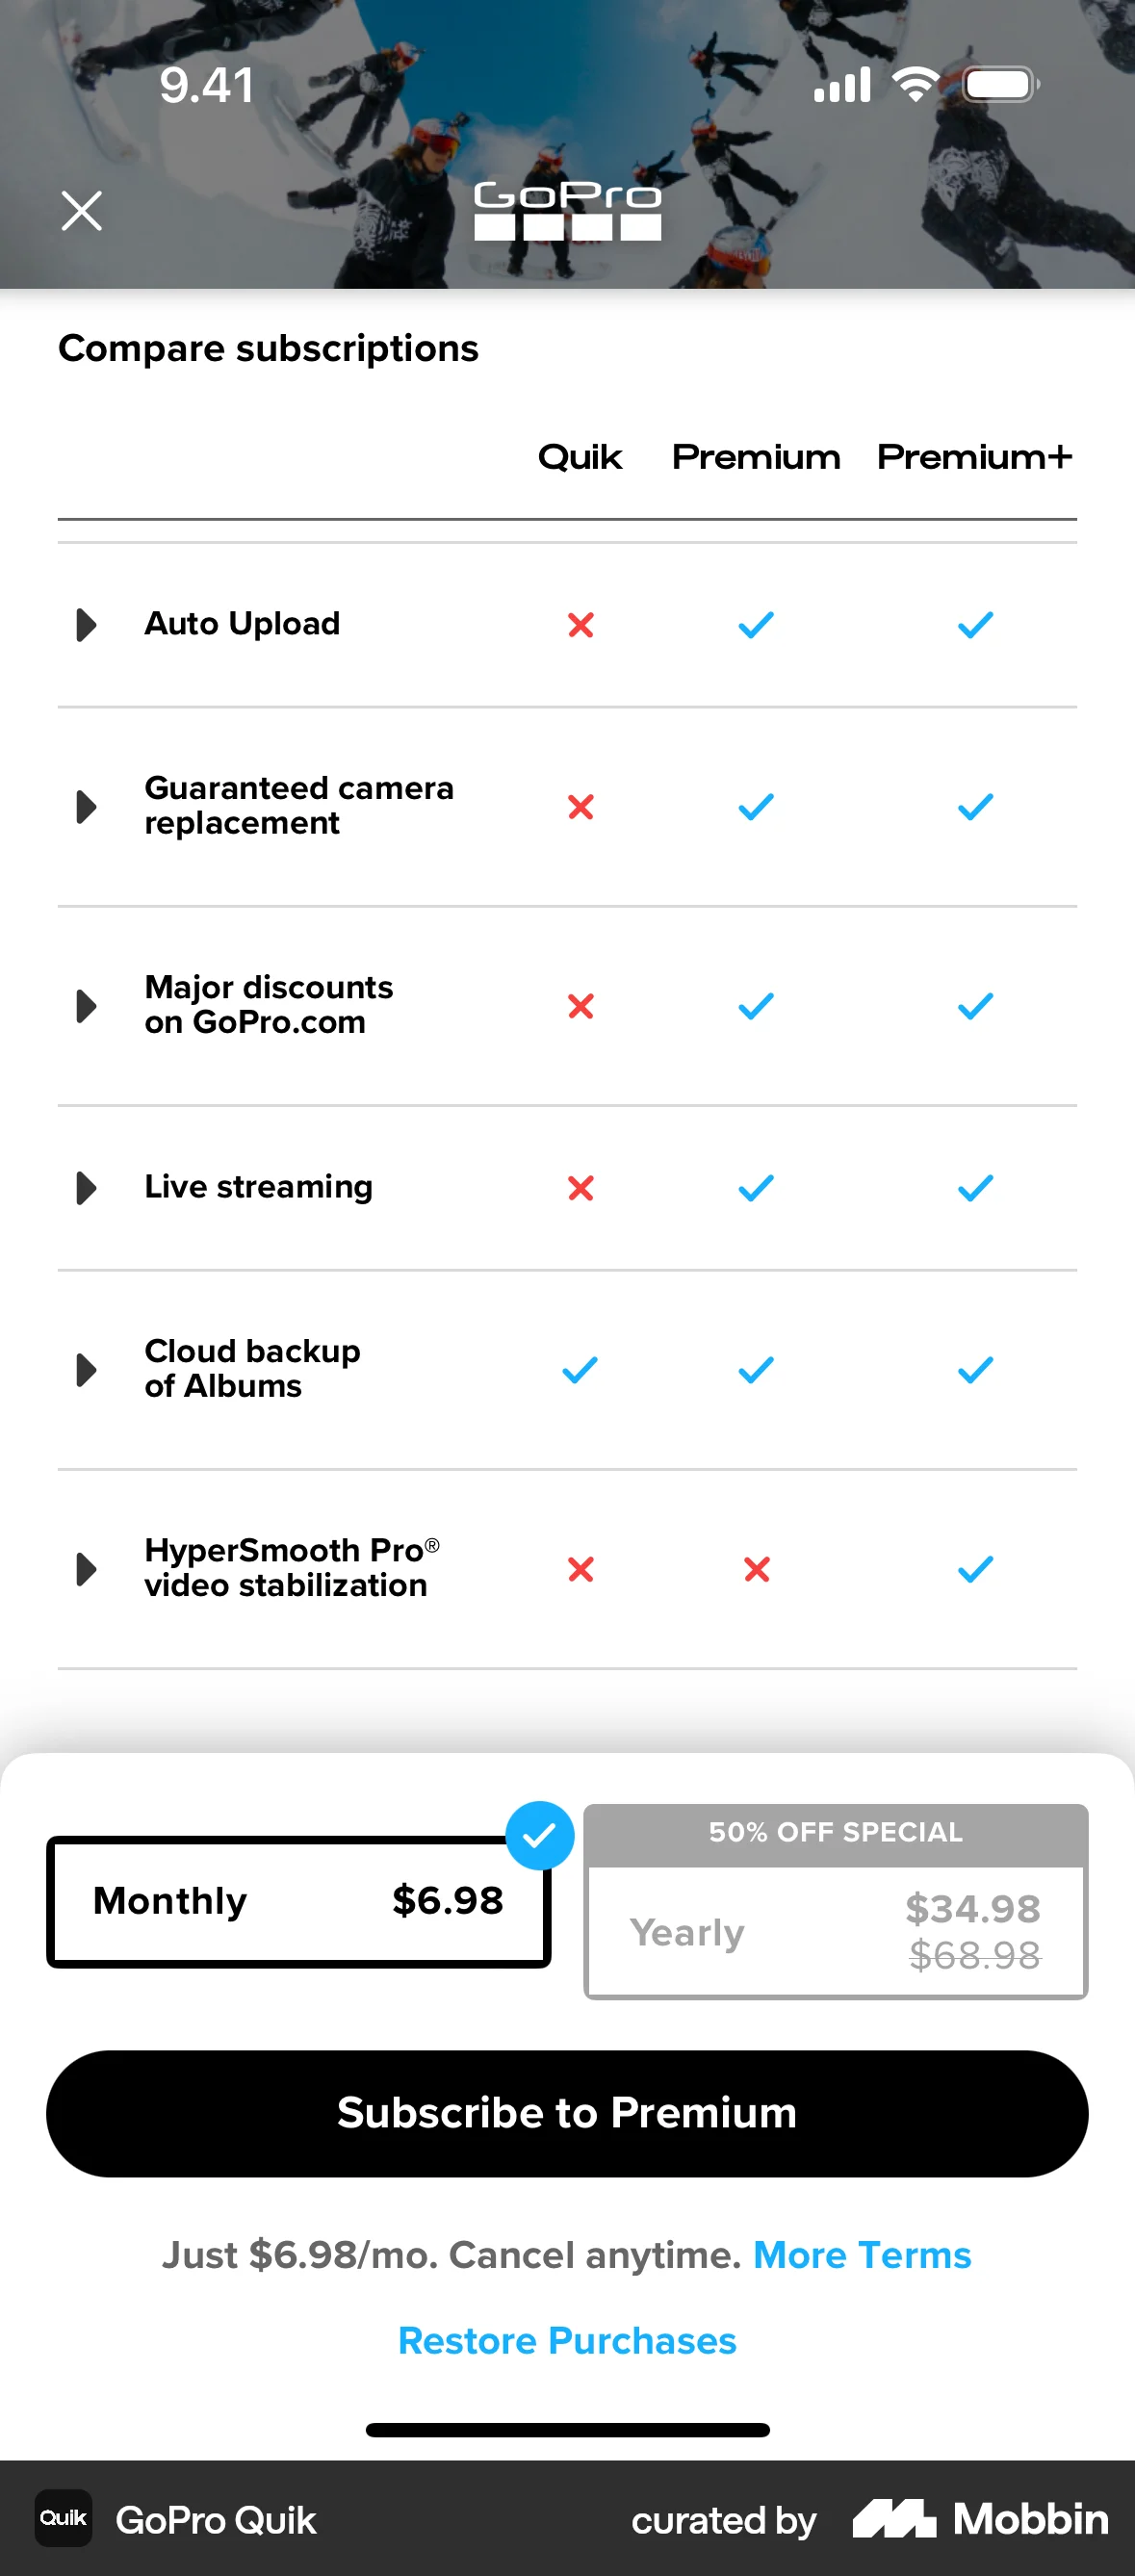
- Make the tier you want chosen the balanced one: not worst on any row, not best on any row. A middle tier that is plainly worst on storage or seats reads as the edge of that attribute, and Chernev's reversal is what you get.
- Show all three tiers on one screen with identical rows in identical order, so the trade-off can be split without scrolling or toggling. The comparison is the mechanism; a layout that prevents it removes the effect.
- Give the comparison time: no auto-advancing paywall, no preselected plan that skips the table, no stepper hiding it. The effect needs around six seconds of deliberation to appear at all.
- Keep “not now” available but outside the compared set — a visible link or a later step rather than a fourth card in the row. A no-choice option sitting inside the comparison takes share straight from the middle tier.
- Name the middle tier for the normal case — Standard, Plus, Team — so the label carries the same “this is the usual one” claim the geometry does. In the menu study the word “regular” beat the range.
- On plan-change and cancellation screens, offer a real middle rung between the current plan and leaving, with its own feature set rather than the full plan minus arbitrary limits.
What to avoid
- Listing a top tier you do not intend to sell. Annex I of the EU Unfair Commercial Practices Directive makes it unfair in all circumstances to invite purchase at a specified price without disclosing reasonable grounds for believing you cannot supply it (point 5), and to invite purchase and then refuse to show, order or deliver it in order to promote something else (point 6).
- Dressing the middle tier with a struck-through price it never had. Article 6a of Directive 98/6/EC, inserted by Directive (EU) 2019/2161, requires any announcement of a price reduction to state the prior price, defined as the lowest price applied in at least the previous 30 days.
- Badging the middle tier “most popular” when it is not. That is a factual claim about other customers' behaviour, and it is the one element of this layout a user can check against you.
- Padding the top tier with entitlements nobody can use so that the middle looks reasonable. Each tier has to be a real product someone would rationally buy, which is also the condition under which the top tier is not bait.
- Removing the option people actually wanted in order to shift them upward. Sharpe and colleagues' estimates show dropping the smallest size works commercially precisely because it strands the people who wanted it.
- Expecting the effect where the real choice is buy or nothing — a signup wall, an upsell interstitial, a cold landing page. A no-choice alternative weakens this effect specifically, unlike the attraction effect, which it strengthens.
- Sizing a test on lab numbers. Published relative-share swings of 17 to 34 points come from forced choices among abstract options; with money at stake the measured shift is nearer 3 to 5 points.
Real-world examples



Measuring it
- Primary metric: the target tier's share of itself plus the neighbour it competes with — target ÷ (target + neighbour) — against a two-tier control cell. That is the convention every replication uses, so your number stays comparable to theirs.
- Secondary: revenue or margin per visitor, and overall conversion. The narrow ask string lowered the donation rate as well as the amount, so a wider range can win on both at once — and a share shift with falling conversion is a loss.
- Backfire metric: the absolute share of the two extreme tiers. They are real choices, not scenery, and a flanking option can take a quarter to a third of all choices, so a cheap tier you did not plan to sell may become your mix.
- Backfire metric: downgrades, refunds and cancellations inside the first billing period, plus support contacts asking what the difference between tiers is. A middle tier chosen because it looked safe rather than because it fitted shows up here, not in the signup number.
- Guardrail: rotate which card renders in the centre and which carries the badge, and watch time on the pricing view. Centre-stage and inferred-popularity effects move choice on their own, and if most sessions decide in under about five seconds a flat result is about your layout, not the principle.
References
- Simonson (1989). Choice Based on Reasons: The Case of Attraction and Compromise Effects. Journal of Consumer Research.
- Simonson & Tversky (1992). Choice in Context: Tradeoff Contrast and Extremeness Aversion. Journal of Marketing Research.
- Dhar & Simonson (2003). The Effect of Forced Choice on Choice. Journal of Marketing Research.
- Chernev (2004). Extremeness Aversion and Attribute-Balance Effects in Choice. Journal of Consumer Research.
- Kivetz, Netzer & Srinivasan (2004). Alternative Models for Capturing the Compromise Effect. Journal of Marketing Research.
- Sharpe, Staelin & Huber (2008). Using Extremeness Aversion to Fight Obesity: Policy Implications of Context Dependent Demand. Journal of Consumer Research.
- Valenzuela & Raghubir (2009). Position-based beliefs: The center-stage effect. Journal of Consumer Psychology.
- Rodway, Schepman & Lambert (2012). Preferring the One in the Middle: Further Evidence for the Centre-stage Effect. Applied Cognitive Psychology.
- Pettibone (2012). Testing the effect of time pressure on asymmetric dominance and compromise decoys in choice. Judgment and Decision Making.
- Trueblood, Brown, Heathcote & Busemeyer (2013). Not Just for Consumers: Context Effects Are Fundamental to Decision Making. Psychological Science.
- Huber, Payne & Puto (2014). Let's Be Honest About the Attraction Effect. Journal of Marketing Research.
- Neumann, Böckenholt & Sinha (2016). A meta-analysis of extremeness aversion. Journal of Consumer Psychology.
- Dumbalska, Li, Tsetsos & Summerfield (2020). A map of decoy influence in human multialternative choice. Proceedings of the National Academy of Sciences.
- Ekström (2021). The (un)compromise effect: How suggested alternatives can promote active choice. Journal of Behavioral and Experimental Economics.
- Mckay, Kemps, Prichard & Tiggemann (2023). Small, regular or large? The effect of size options on online food choices. Food Quality and Preference.
- European Parliament & Council (2005). Directive 2005/29/EC on unfair business-to-consumer commercial practices, Annex I points 5 and 6.
- European Parliament & Council (2019). Directive (EU) 2019/2161, Article 2, inserting Article 6a on price reduction announcements into Directive 98/6/EC.
For agents
An agent-friendly guide to this principle lives at /agents/compromise-effect.md.
Our MCP server and skills for all principles are coming soon.
Similar principles
Disclaimer: The theories here are just that — theories. They may not apply universally and should be considered in context. Use your own judgment and consult additional sources when applying these principles.