Planning fallacy
The planning fallacy is the tendency to build a time prediction from a smooth mental scenario of the task ahead rather than from what similar tasks actually took. It shows up on big, novel, self-relevant work and largely disappears on short, familiar work.
In Buehler, Griffin and Ross's founding study, honours students asked to predict as accurately as possible when they would hand in a thesis already under way averaged 33.9 days against an actual 55.5, and 29.7% finished inside the time they had named. Asked for the date “if everything went as poorly as it possibly could”, they averaged 48.6 days — still short of 55.5, and fewer than half (48.7%) met even that. The estimates were biased but not uninformative, correlating .77 with actual completion, and asking for a pessimistic figure moved the number without improving absolute accuracy: a worst-case field does not buy a calibrated estimate.
The mechanism is attention to the plan rather than to past experience. Think-aloud protocols in the same paper were dominated by future steps with almost no reference to how earlier assignments had gone, and observers given the same situation drew more on past cases and predicted longer. Study 4 is the debiasing result everything else leans on: students underestimated a computer assignment by 1.3 days in the control condition, 1.0 day when merely asked to recall similar past assignments, and 0.1 days when additionally walked through questions tying those past cases to this one, with 60.0% of that group finishing inside their prediction against 38.1% and 29.3%. Read the whole result: absolute error did not improve in any condition, and what moved actual completion was the deadline — 4.3 days under a one-week deadline against 9.1 under two weeks.
The headline generalisation does not survive the wider literature. Halkjelsvik and Jørgensen's Psychological Bulletin review of judgment-based performance-time predictions reports typical average unsigned errors of 20–30% and no general tendency towards either overoptimistic or overpessimistic predictions across the tasks and projects they could collect. Everyday tasks predicted in the laboratory came out on average unbiased, as did smaller professional software tasks, and where lateness carries a sharp penalty — telling a waiting customer when food will arrive — people are overpessimistic. What exists instead is a magnitude effect: where the experimenter fixes task size, larger tasks are underestimated and smaller ones overestimated. The field version of that effect is inflated: of 13 studies compared, all seven that measured task size by actual time or cost found larger tasks more underestimated, while those measuring size by predicted time or budget found little or none, because using the outcome as the size variable manufactures the correlation. Underestimation is therefore a claim about a region — long, open-ended, unfamiliar work the person is invested in — not about people, and treating a two-minute form like a Sydney Opera House is the first mistake.
That makes “break the task down” a direction, not a fix. In Forsyth and Burt's three experiments a single future task always received significantly less time than its summed subtasks, and marking estimates on a timeline ruled out rounding. Decomposition reliably raises the number, which helps only when the number was too low. In two office-task experiments, decomposed predictions ran 9% and 10% too high where holistic predictions of the same work ran 2% and 5% too high; in a setting that did skew low, decomposed predictions ran 0% and 8% too low against 13% and 26% for the whole. Connolly and Dean found decomposed estimates of software writing tasks higher but less accurate than holistic ones. Aggregation is arithmetically fragile as well: summing most-likely component times instead of means gives a total that is too low even when every component is honest.
Which components you name decides the direction. In Hadjichristidis, Summers and Thomas's document-formatting task, a packed description drew a mean estimate of 8.48 minutes, naming the fiddly step (phonetic characters) drew 12.73, and naming a quick step (italics and bold) drew 6.24. On getting ready for a date, packed drew 57.76 minutes, naming an early step 74.46, naming a late step 48.81, and naming typical components changed nothing. Kruger and Evans's enumeration result is the upward half of this pattern; the downward half is the part product teams need, because a step list naming the easy or final steps lowers the estimate. Concrete step-by-step planning has also been observed to increase overoptimism specifically in completion-date predictions, which is the prediction a progress tracker invites.
The intervention with the better institutional record is the outside view. Flyvbjerg, Holm and Buhl found an 86% chance that a randomly chosen project cost more than estimated across 258 transport infrastructure projects worth about $90 billion, with average overruns of 44.7% for rail, 33.8% for bridges and tunnels and 20.4% for roads, 27.6% overall; they conclude error cannot explain the pattern and strategic misrepresentation can — a cause no debiasing of the forecaster touches. Forecasting from the distribution of outcomes in a reference class of past projects is policy rather than hypothesis: HM Treasury's supplementary Green Book guidance has appraisers start from an upper-bound uplift drawn from historical projects and justify any reduction, with works-duration uplifts from 4% upper and 1% lower for standard buildings to 54% and 10% for equipment and development. That is an adopted, data-derived correction, not a controlled trial. No randomised evidence shows reference-class forecasting beats the inside view, and the one observational software comparison, by Furulund and Moløkken-Østvold — projects using estimation checklists averaging 10% too low against 38% too low for projects that did not — is not randomised either.
Almost none of this has been tested inside a product interface, and the one controlled strand runs against the easy advice. Galesic and Bosnjak randomly announced the same web questionnaire as taking 10, 20 or 30 minutes: the longer the stated length, the fewer people started and the fewer completed. An honest estimate at the top of a flow is a real cost, which is why it gets shaved, and nothing in the literature shows an accurate estimate recovers that cost later in retention or trust. A step tracker is no free substitute either: Villar, Callegaro and Yang meta-analysed 32 randomised progress-indicator experiments and found constant indicators did not reduce drop-off overall, fast-to-slow indicators reduced it, slow-to-fast indicators increased it, and a constant indicator raised drop-off where a small incentive had been promised.
Where a user types the estimate, the field sets the answer. In Jørgensen's experiment software professionals predicting in workdays gave the equivalent of 88 work hours on a task where those predicting in work hours gave 45, and 335 against 224 on a larger one. Halkjelsvik and Jørgensen close with the ways to extract an overoptimistic prediction — a low anchor, several bids with the lowest taken, a small task asked about first, rewards for speed, a fine-grained unit — which is a list of things estimate fields, bidding marketplaces and sprint tools do by accident. The overall picture is mixed: the original demonstration is solid for the narrow case it covers, the general claim is not supported, and both remedies the folk version recommends are either conditional on the direction of the existing bias or untested in an interface.
When it holds
- It holds for long, novel, open-ended work the person is invested in — the thesis study found a 21.6-day gap on a 55.5-day project — and is weak or absent for short, familiar, repeated tasks, which a review of the whole literature found on average unbiased.
- It reverses for small tasks. Controlled experiments that fix task size by design find smaller tasks overestimated, so a brief step is more likely to be padded than shaved.
- It reverses where lateness is punished. Where an overoptimistic promise has immediate negative consequences, such as a waiting customer, predictions come out overpessimistic.
- It is a bias about the self. Observers predicting the same task gave 8.5 days where actors gave 5.5, and drew more on relevant past cases; an estimate produced by someone other than the performer is not the same estimate.
- Field evidence for “bigger means later” is partly an artefact. Of 13 studies compared in the review, every one that measured task size by actual time or cost found larger tasks more underestimated, while those measuring size by predicted time or budget found little or none.
- On institutional projects the cause may not be cognitive at all. Flyvbjerg and colleagues conclude that underestimation across 258 transport projects is better explained by strategic misrepresentation than by error, so debiasing a forecaster does nothing about an incentive to lowball.
- Debiasing by connecting past cases to the current task removed the bias but not the error: absolute deviation was no smaller in that condition, and the manipulation changed predictions without changing when anyone finished.
How to apply
- Derive the displayed estimate from your own completion telemetry for that flow — the median and a high percentile of time-to-finish for users like this one — not from an internal guess at how long the steps should take. This is the reference-class move, and it is the only input with a record behind it.
- Show a labelled range or high percentile instead of one number (“most people finish in 4–7 minutes”). A single figure invites the same scenario-based optimism from your team that it does from a user.
- Fix the unit before you write the copy and keep it consistent across the product. The same work drew roughly twice the hours when professionals estimated in workdays rather than work hours, so “about a day” and “about 6 hours” are different promises.
- In a step list, name the slow and early steps and leave the quick and final ones unnamed. Naming a fiddly component raised estimates from 8.48 to 12.73 minutes; naming an easy one cut them to 6.24.
- Count the setup you do not think of as part of the task — finding a document, waiting for an SMS code, a bank redirect, a review queue. A whole task is always allotted less time than its named parts, so unnamed parts are time users never budget.
- Replace a blank estimate field with two prompts where users plan their own effort (a project plan, a sprint field, a savings date): ask about relevant past attempts, then ask how this one differs. That sequence is what removed the bias in the original debiasing experiment.
- Set a short deadline rather than relying on the forecast. A one-week deadline produced completion in 4.3 days against 9.1 for a two-week deadline on identical work; the constraint moved behaviour, the prediction did not.
- Treat an announced duration as an A/B variable with a known cost. Announced survey length rising from 10 to 20 to 30 minutes cut both starts and completions, so expect your honest estimate to reduce starts and take that trade deliberately.
What to avoid
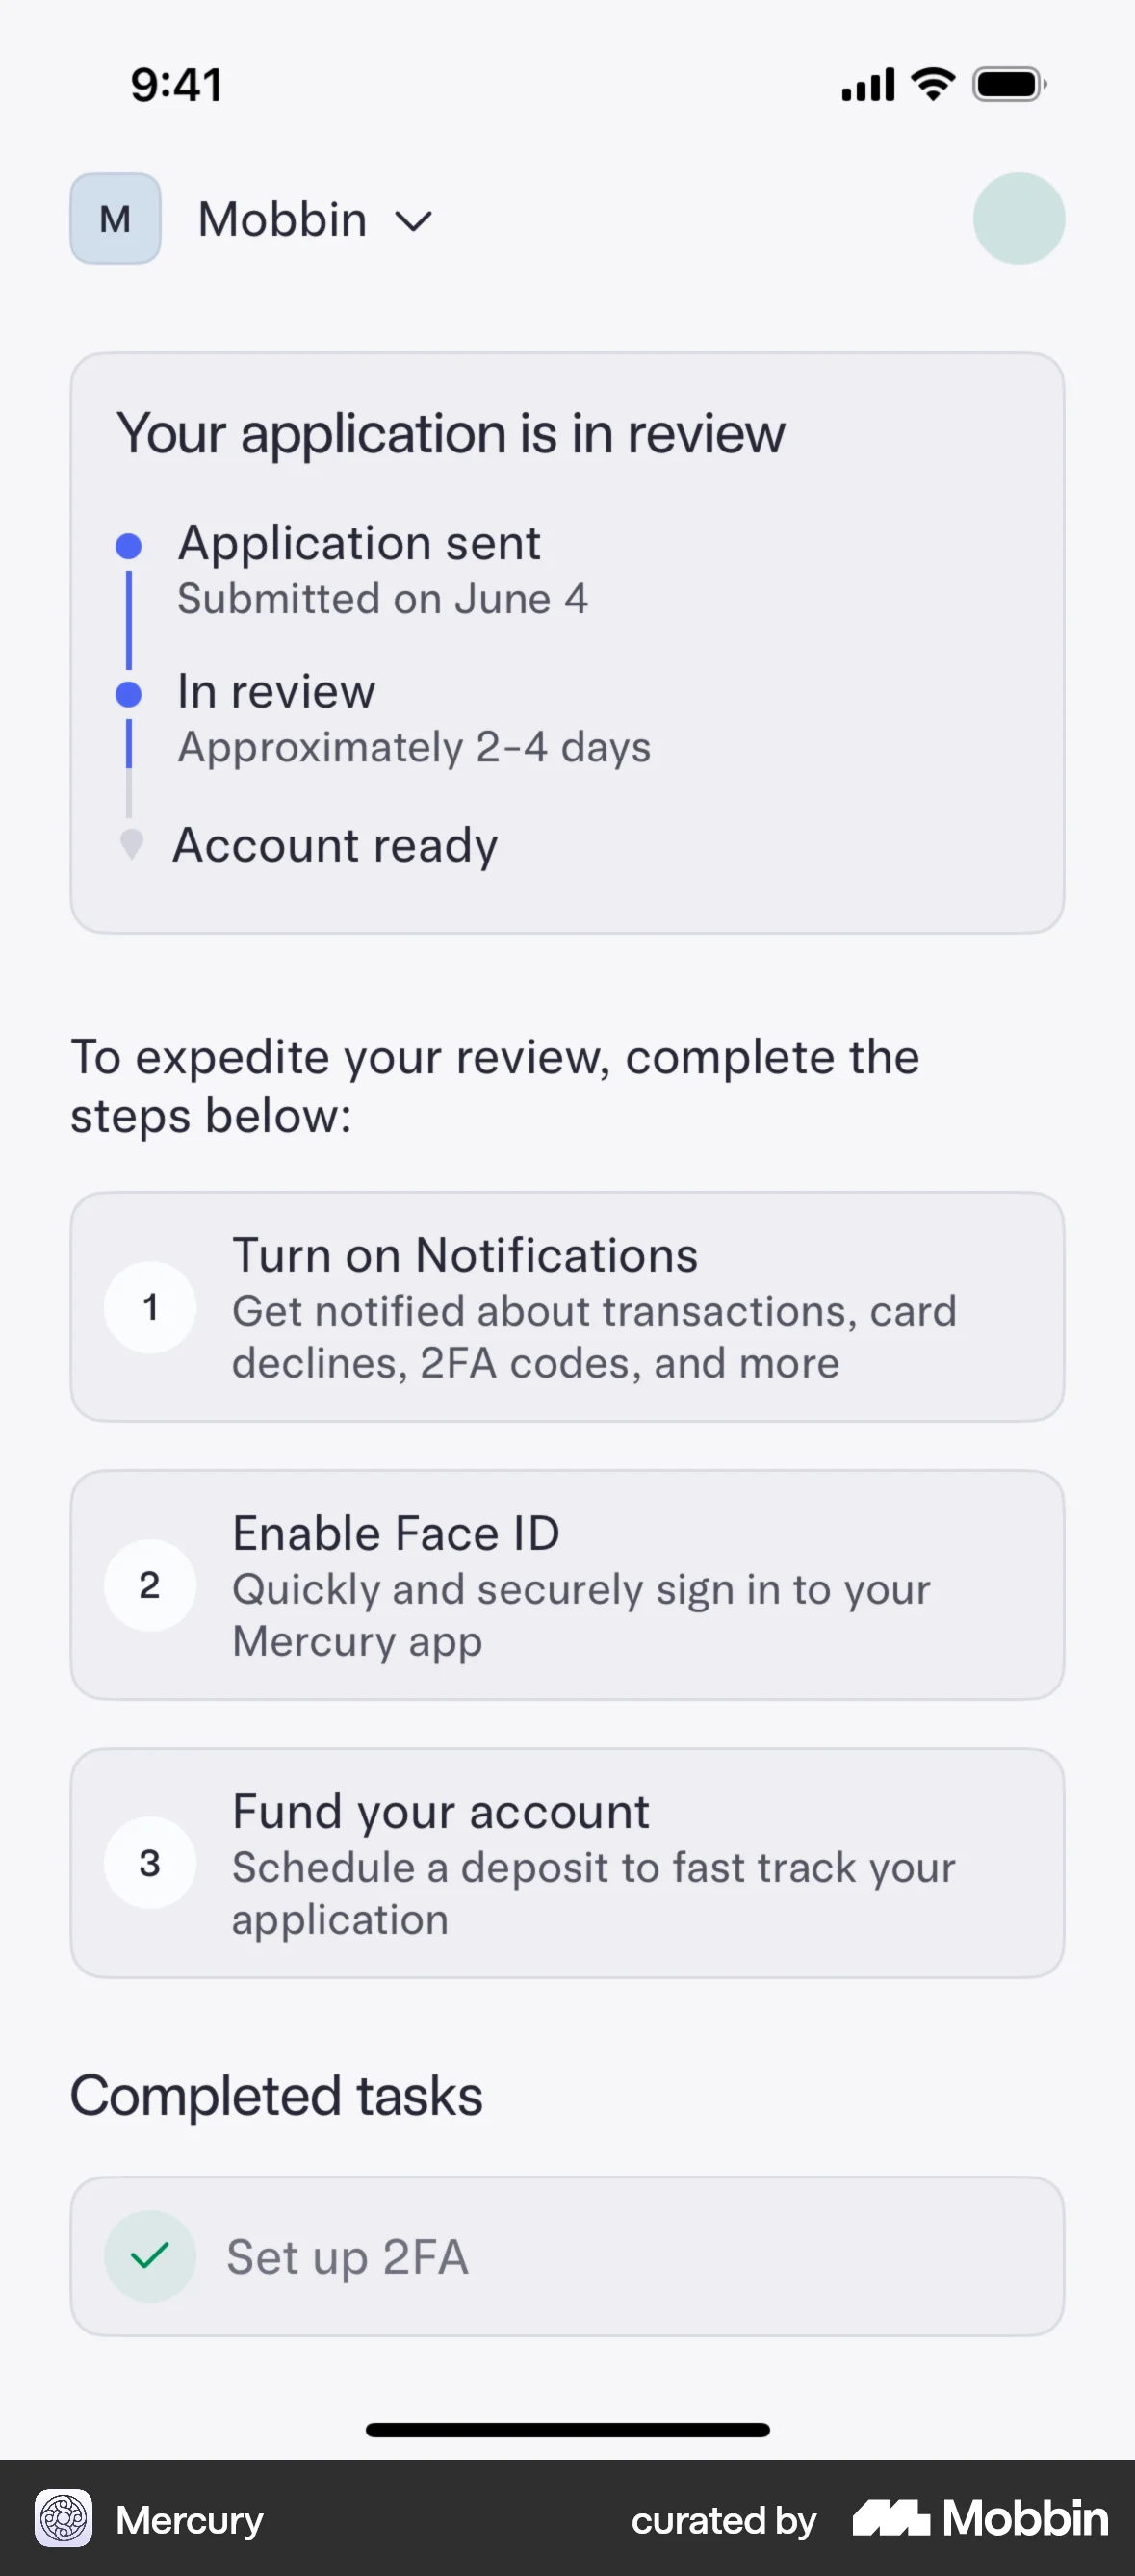
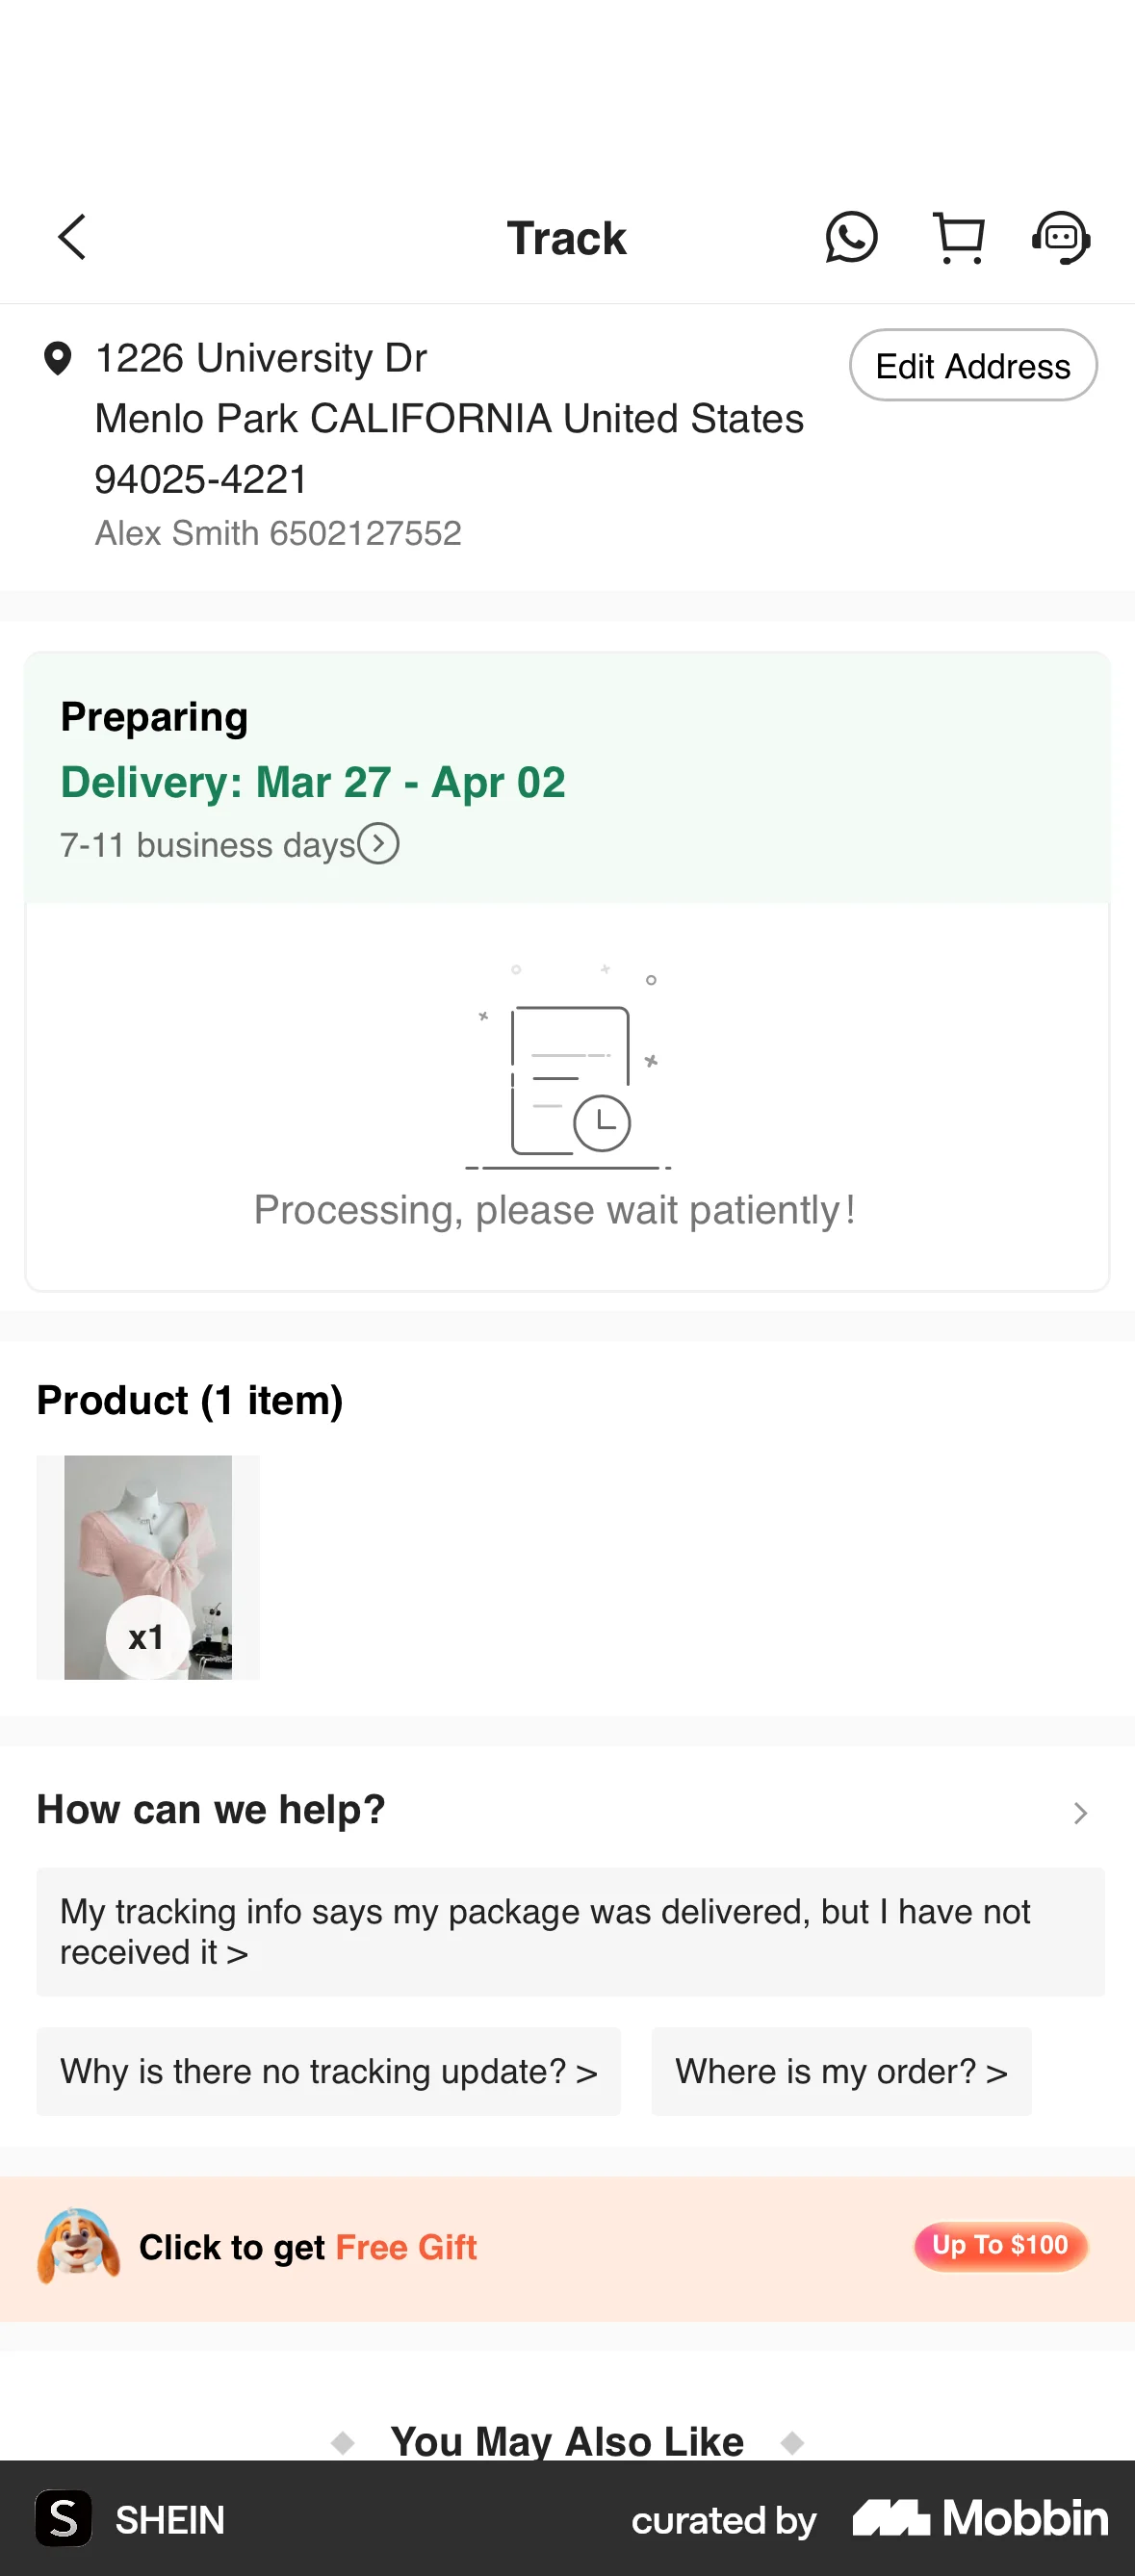
- Stating a time you have not measured. “Takes 2 minutes” on a flow whose median is eleven is the whole anti-pattern, and the gap is usually discovered by the user at step four.
- Quoting a best case as if it were an expectation. In the founding study only 10.8% of people met their own best-case date and under half met their own worst case; your p50 is not a promise and your marketing number is probably below your p50.
- Adding up most-likely step times to get a total. Only mean times are additive; summing modal estimates produces a total that is systematically too low even when every component is given honestly.
- Assuming a step list or progress bar fixes the problem. A meta-analysis of 32 randomised experiments found constant progress indicators did not reduce drop-off overall, slow-to-fast indicators increased it, and a constant indicator increased drop-off where a small incentive had been promised.
- Padding short tasks. Small tasks are the ones people already overestimate, so an inflated estimate on a 30-second action buys nothing and makes a trivial step look like a chore.
- Designing estimate inputs that pull the number down: a pre-filled low default, a fine-grained unit, a small task asked about first, a reward for speed, or picking the lowest of several bids. Those are a published recipe for extracting overoptimistic predictions, and a marketplace or planning tool can implement all five by accident.
- Understating duration in a commercial claim. In the UK a commercial practice involves a misleading action where it provides false or misleading information relevant to a transactional decision, including information that is true but presented in a misleading way, under section 226 of the Digital Markets, Competition and Consumers Act 2024, in force since 6 April 2025. “Set up in 2 minutes” on a fifteen-minute onboarding is within reach of that.
Real-world examples



Measuring it
- Primary metric: share of users who finish inside the stated figure or range, segmented by device and by new against returning, rather than mean error alone.
- Secondary metric: p50 and p90 time-to-complete for the flow. A good median with a long tail keeps a published estimate honest for most people and wrong for the ones most likely to churn.
- Backfire metric: start rate on the screen carrying the estimate. An accurate, larger number should be expected to reduce starts, as announced survey length did, so size that loss before calling the honest estimate free.
- Backfire metric: step-level abandonment against the stated time, and against a no-list control if a step tracker is the intervention. Drop-off clustering just past the quoted duration is the signature of an estimate the user has now disproved.
- Backfire metric: for users whose actual time exceeded the stated time, support contacts, return rate to the flow and completion of the next optional step — the cost of a shaved estimate shows up after the session, not in it.
References
- Buehler, Griffin & Ross (1994). Exploring the “Planning Fallacy”: Why People Underestimate Their Task Completion Times. Journal of Personality and Social Psychology.
- Halkjelsvik & Jørgensen (2012). From Origami to Software Development: A Review of Studies on Judgment-Based Predictions of Performance Time. Psychological Bulletin.
- Halkjelsvik & Jørgensen (2018). Time Predictions: Understanding and Avoiding Unrealism in Project Planning and Everyday Life. Simula SpringerBriefs on Computing.
- Forsyth & Burt (2008). Allocating Time to Future Tasks: The Effect of Task Segmentation on Planning Fallacy Bias. Memory & Cognition.
- Hadjichristidis, Summers & Thomas (2014). Unpacking Estimates of Task Duration: The Role of Typicality and Temporality. Journal of Experimental Social Psychology.
- Kruger & Evans (2004). If You Don't Want to Be Late, Enumerate: Unpacking Reduces the Planning Fallacy. Journal of Experimental Social Psychology.
- Connolly & Dean (1997). Decomposed Versus Holistic Estimates of Effort Required for Software Writing Tasks. Management Science.
- Buehler & Griffin (2003). Planning, Personality, and Prediction: The Role of Future Focus in Optimistic Time Predictions. Organizational Behavior and Human Decision Processes.
- Flyvbjerg, Holm & Buhl (2002). Underestimating Costs in Public Works Projects: Error or Lie? Journal of the American Planning Association.
- HM Treasury (2003). Supplementary Green Book Guidance: Optimism Bias.
- Furulund & Moløkken-Østvold (2007). Increasing Software Effort Estimation Accuracy Using Experience Data, Estimation Models and Checklists. QSIC 2007.
- Jørgensen (2016). Unit Effects in Software Project Effort Estimation: Work-Hours Gives Lower Effort Estimates Than Workdays. Journal of Systems and Software.
- Galesic & Bosnjak (2009). Effects of Questionnaire Length on Participation and Indicators of Response Quality in a Web Survey. Public Opinion Quarterly.
- Villar, Callegaro & Yang (2013). Where Am I? A Meta-Analysis of Experiments on the Effects of Progress Indicators for Web Surveys. Social Science Computer Review.
- Digital Markets, Competition and Consumers Act 2024, section 226 (misleading actions).
For agents
An agent-friendly guide to this principle lives at /agents/planning-fallacy.md.
Our MCP server and skills for all principles are coming soon.
Similar principles
Disclaimer: The theories here are just that — theories. They may not apply universally and should be considered in context. Use your own judgment and consult additional sources when applying these principles.