Social comparison
Social comparison is self-evaluation against other people rather than against a standard. It fires hardest where no objective measure exists, and its default result is contrast — the other person's score moves your view of yourself in the opposite direction.
Social proof and social comparison read the same raw material for different ends: social proof treats other people's behaviour as evidence about the right action under uncertainty — reviews, “nine out of ten people pay on time” — while social comparison treats their standing as evidence about the self, in a rank, a benchmark or a percentile. Descriptive norms belong with the first. Festinger's 1954 paper is theory, not experiment, and the hypotheses that read as design instructions are the ones usually skipped. Hypothesis II is conditional — “to the extent that objective, non-social means are not available, people evaluate their opinions and abilities by comparison respectively with the opinions and abilities of others” — so an objective standard of your own lowers the pressure to compare. Hypothesis III says the tendency to compare falls as the ability gap widens, with the person oriented instead toward a point “slightly better than his own performance,” which rules a distant leader out as a comparison target. Hypothesis IV posits a unidirectional drive upward for abilities, largely absent for opinions. Hypothesis VI says people stop comparing when continued comparison implies unpleasant consequences, with hostility or derogation attached — in a product, churn rather than effort.
The claim that comparison produces motivation does not survive the meta-analysis. Gerber, Wheeler and Suls pooled 60-plus years of the literature and found contrast, not inspiration, to be by far the dominant reaction: when participants' standing was varied, estimates ran −0.75 to −0.65 for ability and −0.83 to −0.65 for affect. People still choose to compare upward when offered an up-or-down option, with no evidence that downward comparison becomes dominant even under threat. Where a no-comparison control existed, upward and downward targets produced comparable, contrastive reactions. Assimilation — the “they inspire me” story — showed up only as very weak effects under similarity priming, dependent on which publication-bias estimator was used. Motivation is a conditional outcome you have to engineer.
Ranking changes behavior, and the sign depends on the setting. In a UK fruit farm, Bandiera, Barankay and Rasul found that rank incentives for teams cut average productivity by 14% while a monetary-prize tournament raised it by 24%; the losses came only from teams at the bottom of the productivity distribution and the tournament gains only from those at the top. Gill, Kissová, Lee and Prowse randomly allocated rank among equal-effort subjects and found the response U-shaped — “first-place loving and last-place loathing” — so in a short task the bottom pushes back rather than giving up. Rank also sticks: Murphy and Weinhardt, across English school students, found primary-school class rank affected secondary-school test scores, confidence and subject choice independent of ability, more so for boys, and under new peers and teachers unaware of the old ranking. Megalokonomou and Zhang, using random classroom assignment in China, found higher assigned rank raised later performance, more where rank was salient. None of this tells you which sign your own ranking will take.
Ranking against named people and benchmarking against an average are not one pattern. Azmat and Iriberri gave subjects the session average alongside their own score: performance was 17% higher under piece-rate pay and unaffected under flat-rate pay, regardless of relative position — a benchmark moves effort only where effort pays. The affective cost landed anyway, with the happiness gap between those above and below average widening by 8 percentage points under piece rate. Schultz, Nolan, Cialdini, Goldstein and Griskevicius found the reversal in the field: a neighbourhood-average energy message produced savings among heavy users and a boomerang — increased consumption — among households already below the average, and an injunctive cue conveying approval or disapproval eliminated the boomerang. Hermes, Huschens, Rothlauf and Schunk scored individual improvement rather than standing; in a class-randomised trial with primary-school children that raised motivation, effort and maths performance for low achievers without hurting high achievers, with the gains concentrated in girls.
The product-shaped evidence is thinner than the volume of leaderboards shipped would suggest. Sailer and Homner's meta-analysis of gamification in learning found small significant effects — g = 0.49 for cognitive, 0.36 for motivational and 0.25 for behavioral outcomes — with the cognitive effect stable among methodologically rigorous studies and the other two less so, and the effective ingredient for behavioral outcomes was competition combined with collaboration, not competition alone. The best field test is Patel and colleagues' STEP UP trial of gamified step goals over 24 weeks with a 12-week follow-up: competition, support and collaboration all beat control during the intervention — by 920, 689 and 637 daily steps — and only competition was still significantly above control at follow-up, by 569. That is one trial, in a health context, with a four-person comparison group rather than a public ladder.
On the social-media side, the kind of evidence matters. Yoon, Kleinman, Mertz and Brannick found depression related to time on social network sites and to checking frequency with small effects, and more strongly to general and upward comparison — all cross-sectional. Verduyn and colleagues conclude that comparison on these sites is typically contrastive and upward and tracks lower well-being, with passive use raising comparison most. The direction is not settled: in Carraturo and colleagues' review, the only two studies able to establish direction found depression predicting comparison and envy rather than following from it. The causal estimates are much smaller: in Allcott and colleagues' randomised deactivation experiments before the 2020 US election, six weeks off Facebook improved an index of happiness, depression and anxiety by 0.060 standard deviations and six weeks off Instagram by 0.041. Treat comparison as a real mechanism with a small measured causal footprint, and any leaderboard of your own as untested until you have run it.
When it holds
- It needs the absence of an objective standard. Hypothesis II is conditional on non-social means of evaluation being unavailable, so publishing a target, a rubric or a benchmark of your own reduces the pull of other people's numbers.
- The target has to be close to the user. Comparison falls away as the ability gap widens, and the orientation point is “slightly better than his own performance” — a top-100 board is not a comparison target for a median user.
- The default reaction is contrast, not inspiration: ability estimates moved against the target at −0.75 to −0.65, and assimilation appeared only as very weak similarity-priming effects.
- A benchmark moves effort only when effort is rewarded. The session average raised performance 17% under piece-rate pay and had no effect under flat-rate pay.
- Rank and benchmark diverge at the bottom. Last-placed subjects worked hardest in a short lab task, while workplace rank feedback cut productivity 14% with the loss entirely from teams at the bottom.
- It reverses for people already doing better than the comparison. Households below the neighbourhood average increased their energy use when shown it, and an injunctive approval cue was what removed the boomerang.
- Scoring improvement instead of standing removes the harm to the weakest users: it raised motivation, effort and performance for low achievers without hurting high achievers.
- Competition works better with a cooperative element. Competition combined with collaboration was the significant moderator of behavioral outcomes, not competition on its own.
- When comparison becomes unpleasant, people exit rather than try harder. Hypothesis VI ties the cessation of comparison to hostility and derogation toward the people being compared with.
- The causal size is small where it has been measured. Six weeks off Facebook moved a happiness, depression and anxiety index by 0.060 standard deviations; the cross-sectional comparison–depression correlations are much larger.
How to apply
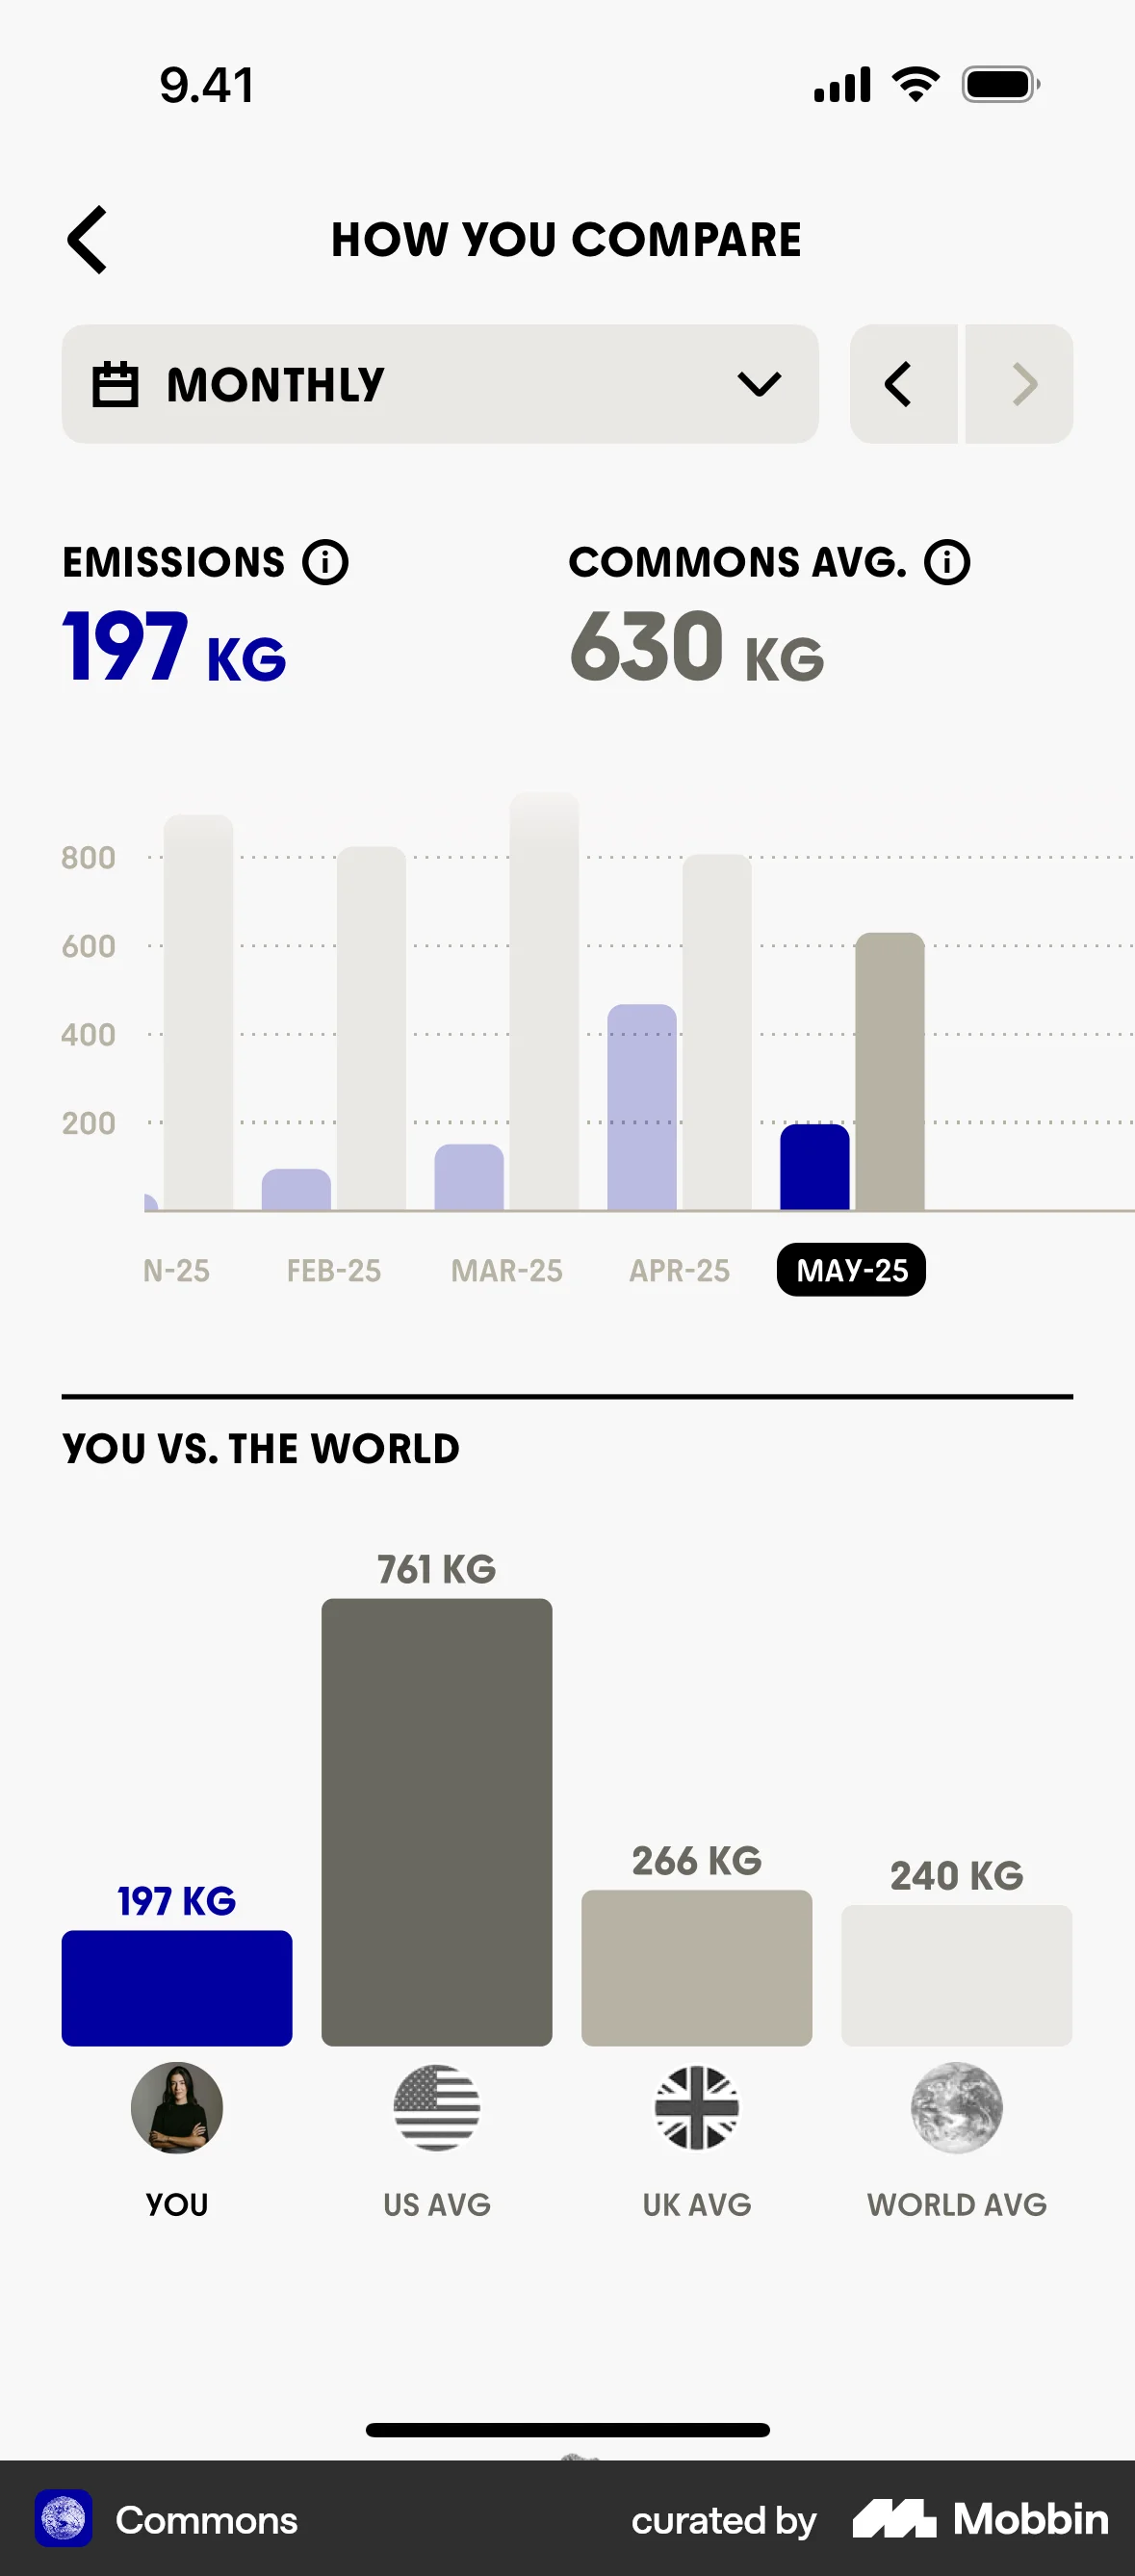
- Show an anonymous peer distribution rather than a named ranking. The benchmark evidence comes with a moderator you can check — is effort rewarded here? — while the ranking evidence has a sign that flipped between −14% and +24% in one firm.
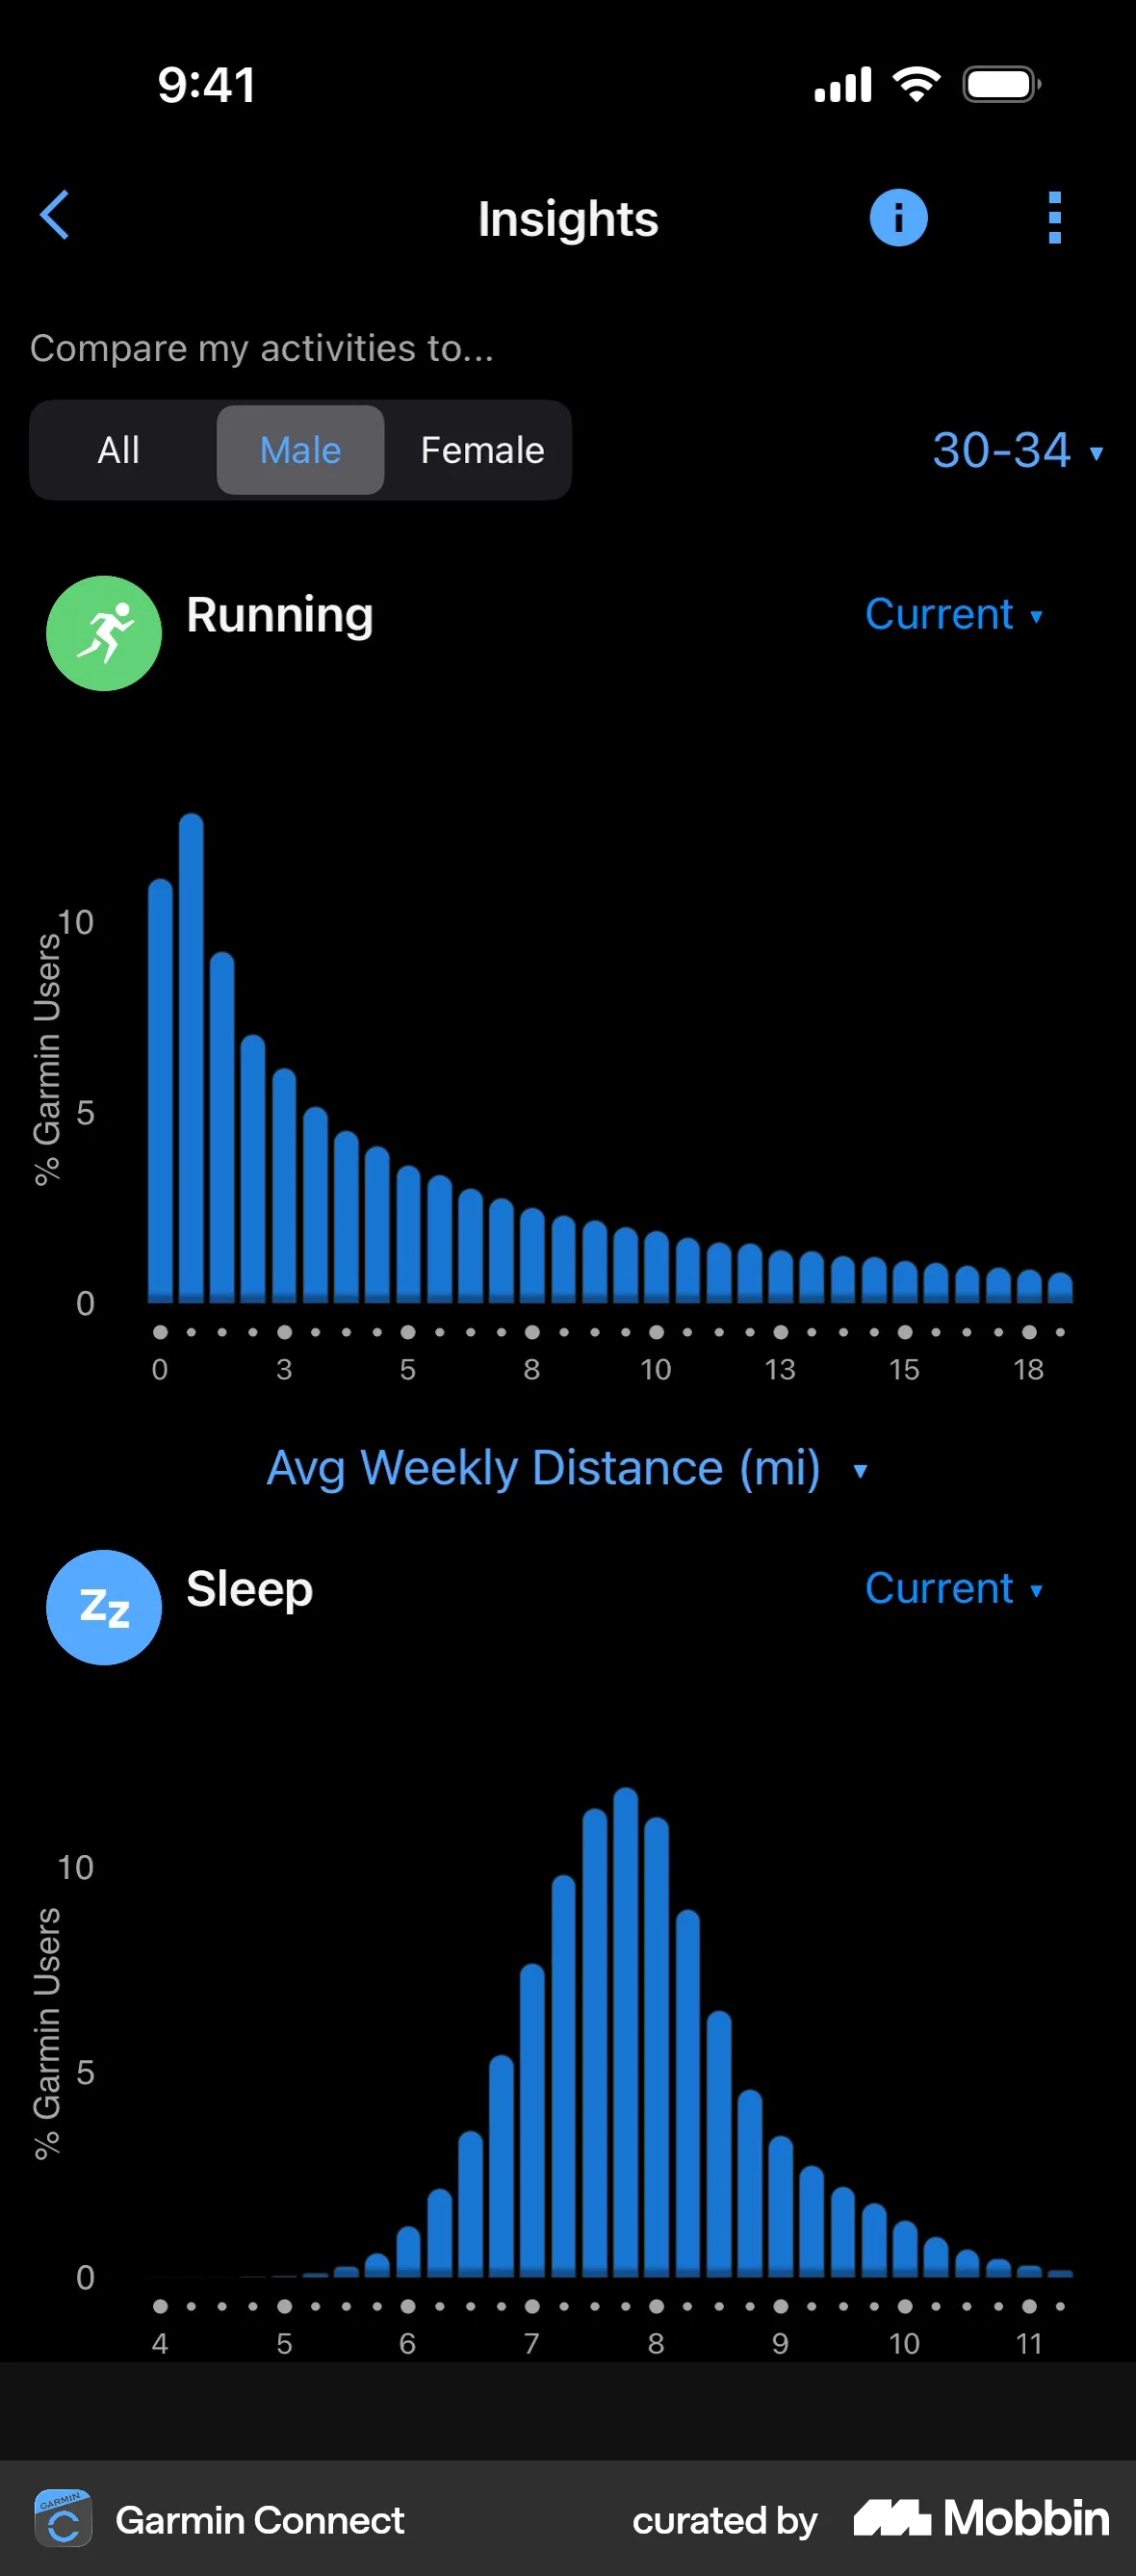
- Compute the peer figure over a tight cohort — same plan, same tenure, same starting point — and label the segment on the screen, as in “users who joined the same month as you.” An all-time board puts the target out of comparison range for most users.
- Put the user's own trajectory next to any peer figure and give improvement its own number. Improvement-scored feedback is the one variant tested to lift low performers without costing high performers.
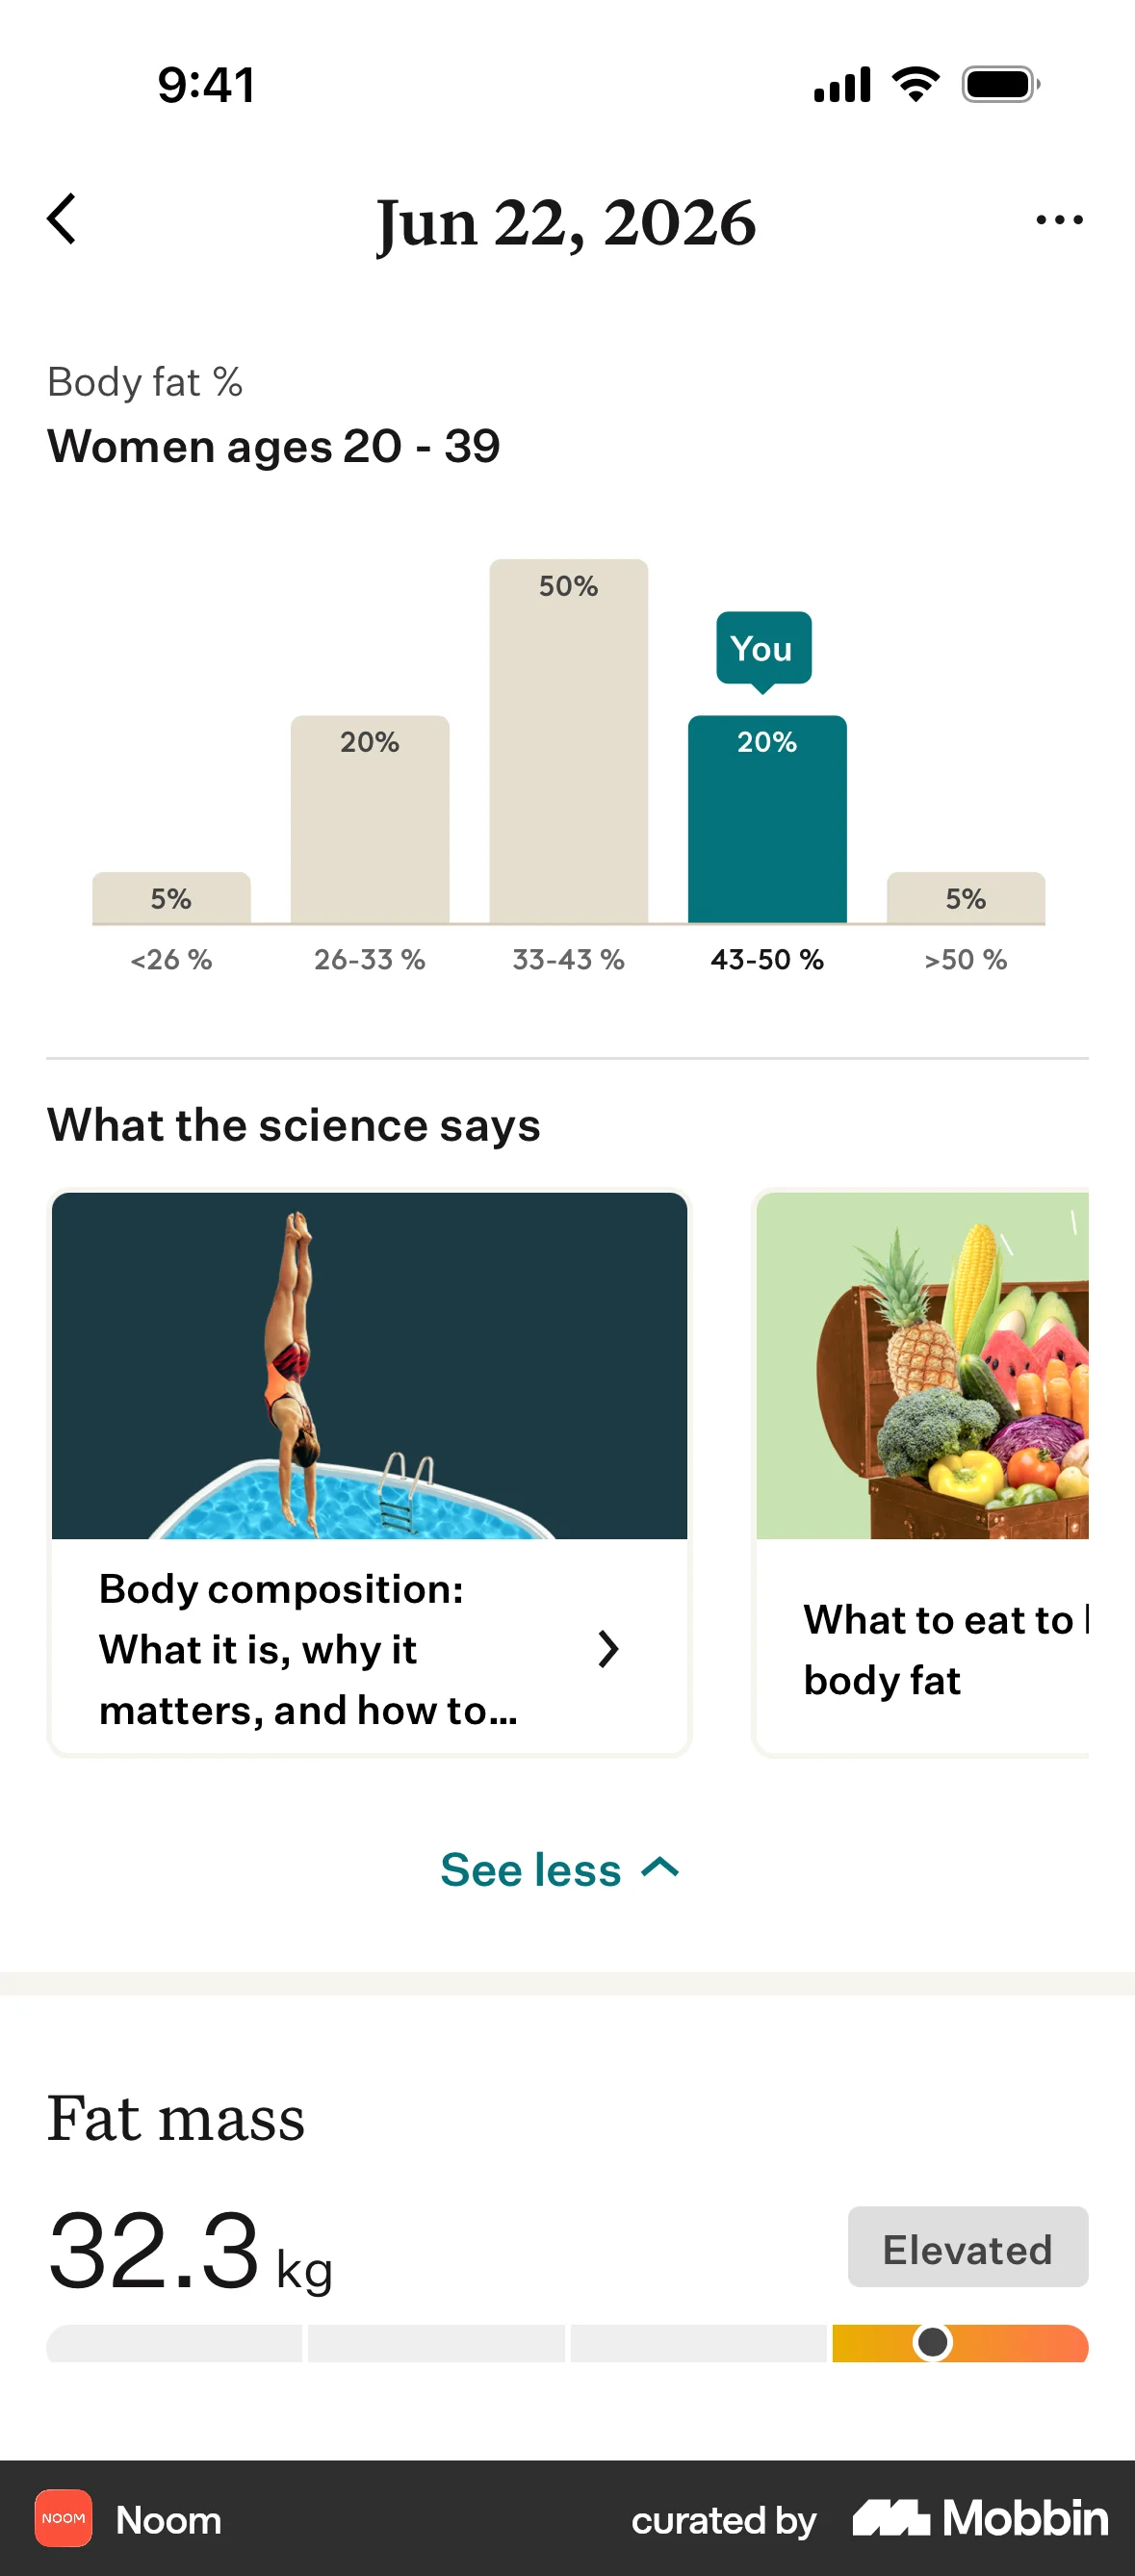
- Pair every benchmark with an injunctive cue: an on-track marker, a target line or a recommended range. Without one, users already ahead of the average drift back toward it.
- Ship your own objective standard — the goal, the healthy range, the plan limit — before you show anyone else's score. The yardstick is cheaper than a ladder and it removes the gap comparison fills.
- Cap a competitive group at a handful of users and give it a shared goal as well as a ranking. The trial that held up at follow-up used a four-person group over 24 weeks, and competition plus collaboration, not competition alone, moved behavior.
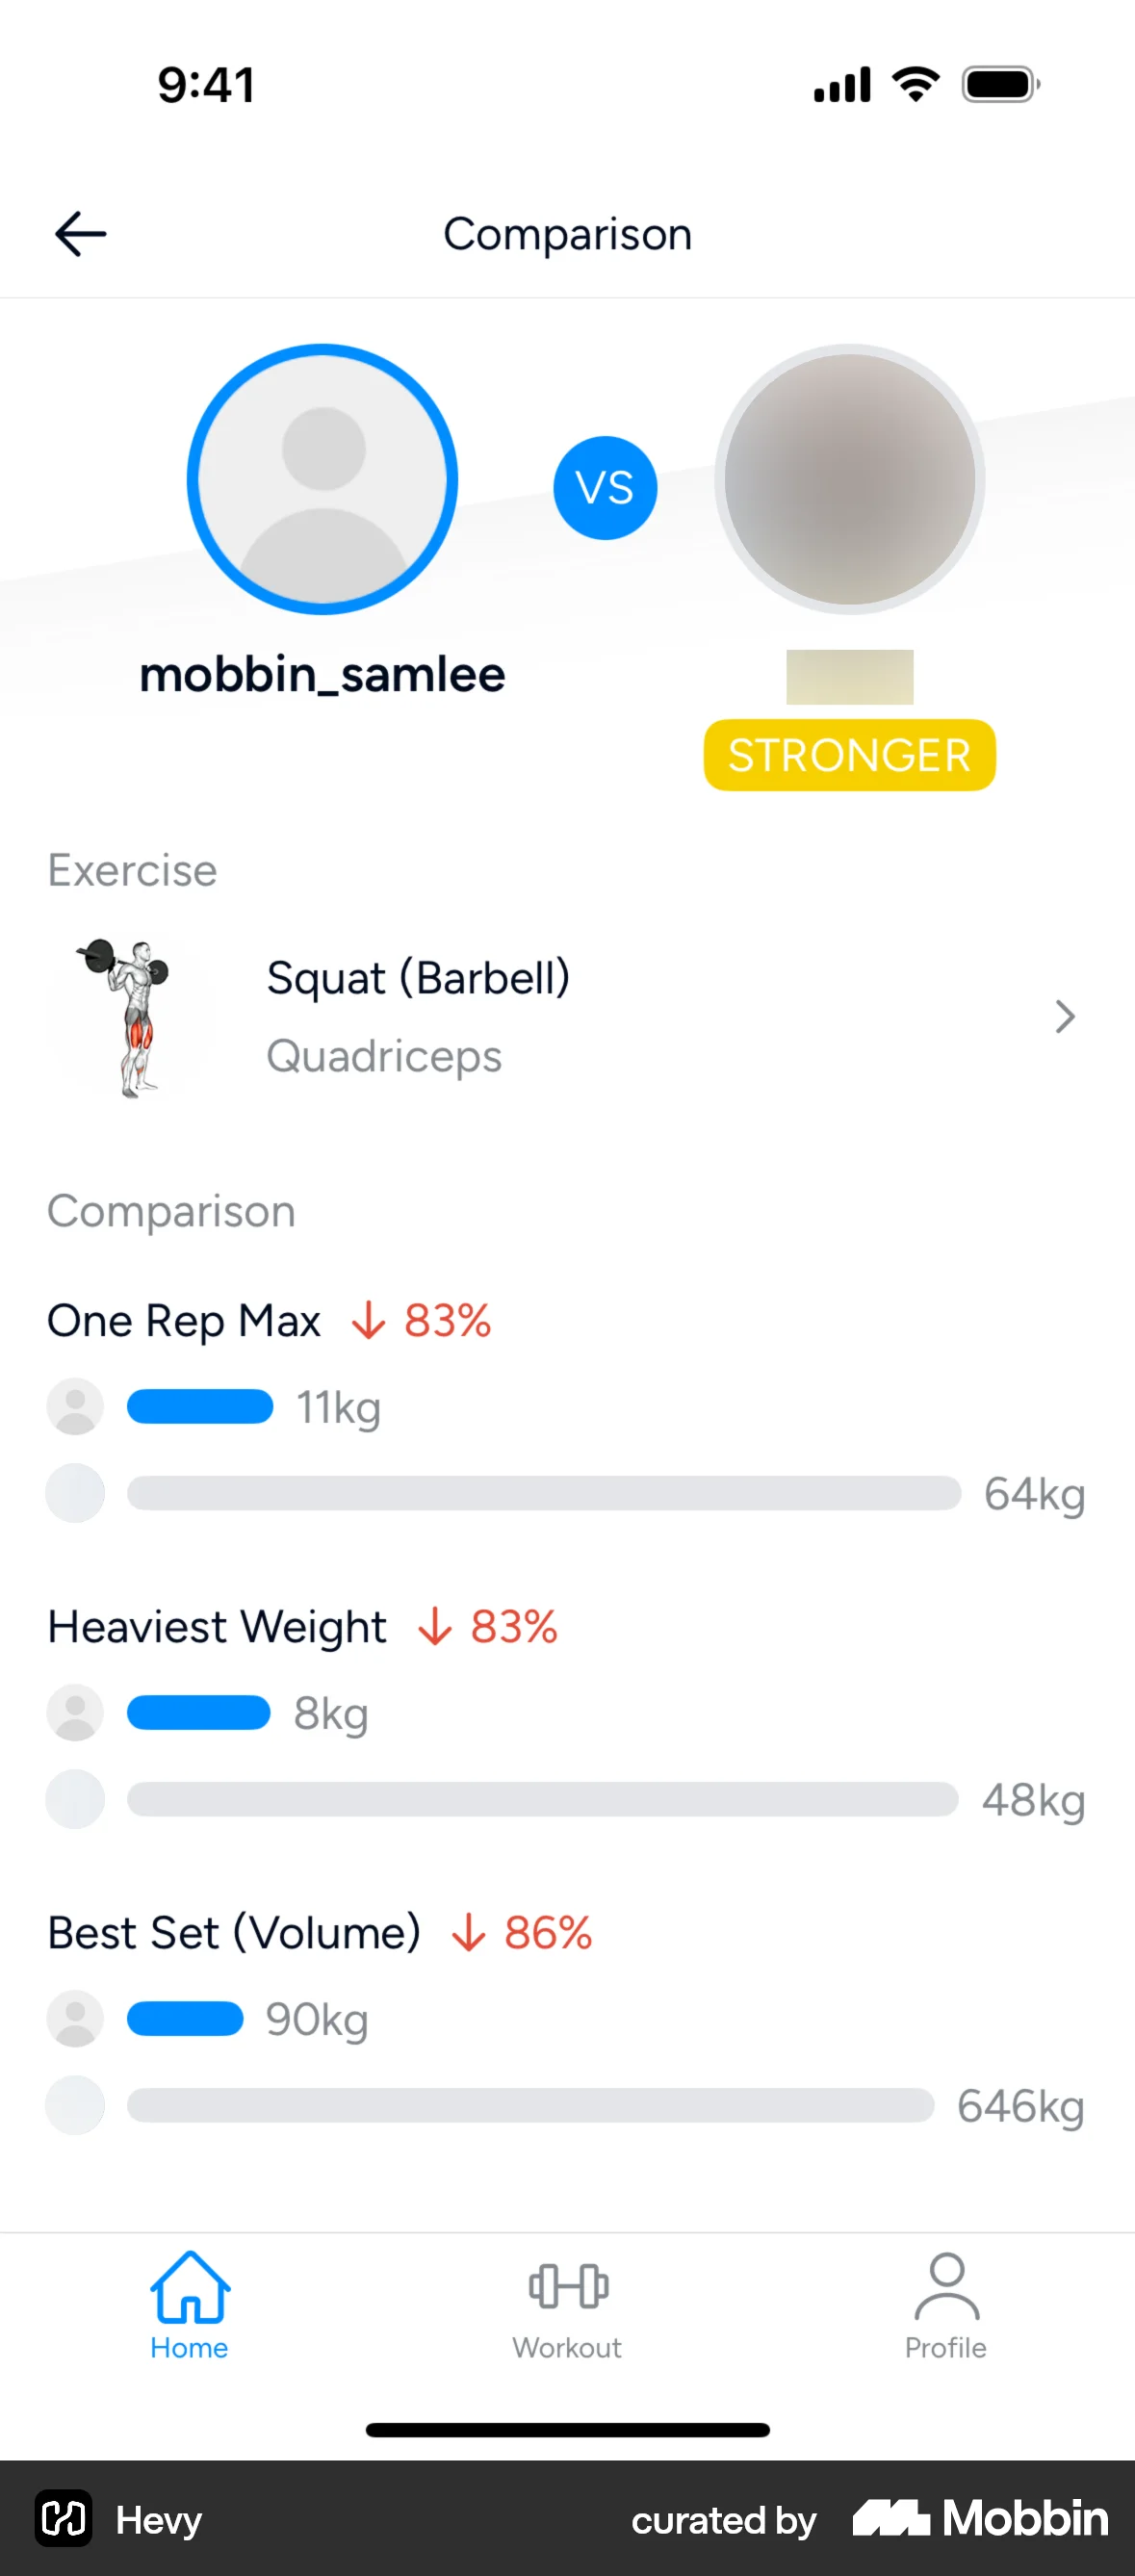
- Make entry into any named or public ranking an explicit opt-in with a visible exit, and keep the user's standing private by default. A leaderboard that names users is publishing personal data: UK GDPR Article 6 requires a lawful basis for that, and consent is the only one that survives the user not wanting to be listed.
- Split your launch metrics by starting decile before the ranking ships, so the bottom of the distribution is visible. That is where the measured workplace loss sat, and in a product the response is users quietly stopping opening the screen.
What to avoid
- Naming or identifying users in a ranking without consent. UK GDPR Article 6(1) makes processing lawful only on one of six bases, and Article 5(1)(c) requires data minimisation — a public ladder of named performance is neither minimal nor covered by the contract you have with the user.
- Fabricating the comparison. A “you're in the top 10%” badge, a peer average or a rank not computed from real measured data is an invented statistic about a named person: use real numbers or ship nothing.
- A single all-user leaderboard as the main motivation surface. Most users sit far below the top, where the target stops being comparable, and the workplace productivity loss was concentrated entirely at the bottom.
- Shaming low performers, including by implication — red states, “below average” labels, last-place callouts. Unpleasant comparison leads people to stop comparing with hostility toward the comparison set, which is churn with a grievance attached.
- Showing an average to users who are already better than it, without a target or approval cue. That is the exact configuration that produced the field boomerang.
- Relying on comparison to drive effort the user gets nothing for. The benchmark lifted output under piece-rate pay and did nothing under flat pay, while the satisfaction gap between above- and below-average users opened up either way.
- Citing the social-media comparison literature as proof your feature will move behavior. Those effects are overwhelmingly cross-sectional, at least one review finds depression predicting comparison rather than the reverse, and the randomised deactivation estimates are around 0.05 standard deviations.
Real-world examples

Measuring it
- Primary metric: the target behavior — sessions, goal completions, measured output — against a variant showing the same data as the user's own progress with no peer figure. Comparing against no feedback at all confounds comparison with feedback.
- Secondary metric: the effect split by starting decile, pre-registered. The published effects change sign across the distribution, so a positive average is compatible with real harm to the bottom quartile.
- Backfire metric: 7- and 28-day retention in the bottom two deciles and opt-out rate from the comparison surface, plus — if the ranking is public — support contacts mentioning other users and any drop in sharing, referrals or community posts. Cessation of comparison looks like disengagement, not complaint.
- Backfire metric: behavior among users already above the benchmark. Watch for output drifting back toward the average you showed them.
- Backfire metric: a self-evaluation item (“how well do you think you are doing?”) alongside the behavioral metric. Contrast is the dominant reaction, so the number can rise while competence beliefs fall.
References
- Festinger (1954). A Theory of Social Comparison Processes. Human Relations.
- Gerber, Wheeler & Suls (2018). A Social Comparison Theory Meta-Analysis 60+ Years On. Psychological Bulletin.
- Bandiera, Barankay & Rasul (2013). Team Incentives: Evidence From a Firm Level Experiment. Journal of the European Economic Association.
- Gill, Kissová, Lee & Prowse (2019). First-Place Loving and Last-Place Loathing: How Rank in the Distribution of Performance Affects Effort Provision. Management Science.
- Murphy & Weinhardt (2020). Top of the Class: The Importance of Ordinal Rank. The Review of Economic Studies.
- Megalokonomou & Zhang (2024). How Good Am I? Effects and Mechanisms Behind Salient Rank. European Economic Review.
- Azmat & Iriberri (2016). The Provision of Relative Performance Feedback: An Analysis of Performance and Satisfaction. Journal of Economics & Management Strategy.
- Schultz, Nolan, Cialdini, Goldstein & Griskevicius (2007). The Constructive, Destructive, and Reconstructive Power of Social Norms. Psychological Science.
- Hermes, Huschens, Rothlauf & Schunk (2021). Motivating Low-Achievers — Relative Performance Feedback in Primary Schools. Journal of Economic Behavior & Organization.
- Sailer & Homner (2020). The Gamification of Learning: A Meta-Analysis. Educational Psychology Review.
- Patel, Small, Harrison, Fortunato, Oon, Rareshide et al. (2019). Effectiveness of Behaviorally Designed Gamification Interventions With Social Incentives for Increasing Physical Activity Among Overweight and Obese Adults: The STEP UP Randomized Clinical Trial. JAMA Internal Medicine.
- Yoon, Kleinman, Mertz & Brannick (2019). Is Social Network Site Usage Related to Depression? A Meta-Analysis of Facebook–Depression Relations. Journal of Affective Disorders.
- Verduyn, Gugushvili, Massar, Täht & Kross (2020). Social Comparison on Social Networking Sites. Current Opinion in Psychology.
- Carraturo, Di Perna, Giannicola, Nacchia, Pepe, Muzii, Bottone & Sperandeo (2023). Envy, Social Comparison, and Depression on Social Networking Sites: A Systematic Review. European Journal of Investigation in Health, Psychology and Education.
- Allcott, Gentzkow, Wittenbrink, Cisneros, Crespo-Tenorio, Dimmery, Freelon & González-Bailón (2025). The Effect of Deactivating Facebook and Instagram on Users' Emotional State. NBER Working Paper 33697.
- UK GDPR (Regulation (EU) 2016/679 as retained), Article 6 (lawfulness of processing).
- UK GDPR (Regulation (EU) 2016/679 as retained), Article 5 (principles relating to processing, including data minimisation).
For agents
An agent-friendly guide to this principle lives at /agents/social-comparison.md.
Our MCP server and skills for all principles are coming soon.
Similar principles
Disclaimer: The theories here are just that — theories. They may not apply universally and should be considered in context. Use your own judgment and consult additional sources when applying these principles.